Chart Deck
Weaponising the fog of war
Markets can’t price what they can’t see. And right now, nobody can see anything.
A weekly visual briefing on gas and LNG market dynamics, published every week in PDF and PPSX formats. The Chart Deck is home to the TTF Risk Model, TTF Sentiment Tracker, Storage-Speculation Nexus regression model and other proprietary analysis of benchmark pricing, arbitrage economics, speculative capital flows and physical trade flows. Available exclusively to subscribers on the Chart Deck and Premium subscription tiers. Latest issues below 👇

Chart Deck
Markets can’t price what they can’t see. And right now, nobody can see anything.
Chart Deck
Markets are failing to reflect compounding supply shortages and Iran conflict escalation risk

Chart Deck
Gas and LNG prices surge, as the storage-speculation nexus lights up along the forward curve
Chart Deck
Hormuz closure and Qatar LNG shut-in trigger extreme volatility in gas, LNG and freight charter rates. The outlook is dire, especially for Europe, but not unremittingly so.
Chart Deck
Our revamped Chart Deck reveals hedge funds are again positioned to capitalise on Europe’s daunting gas storage refilling challenge
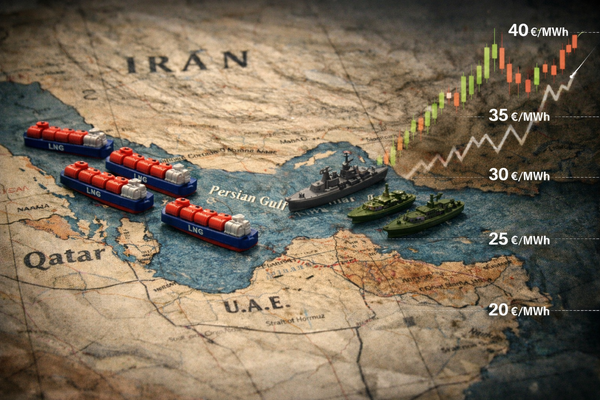
Chart Deck
Without a deep winter buffer, the European gas market is vulnerable to exaggerated price moves
Chart Deck
Too much LNG, not enough comfort
Chart Deck
Who pays when risk management itself becomes riskier and more expensive?
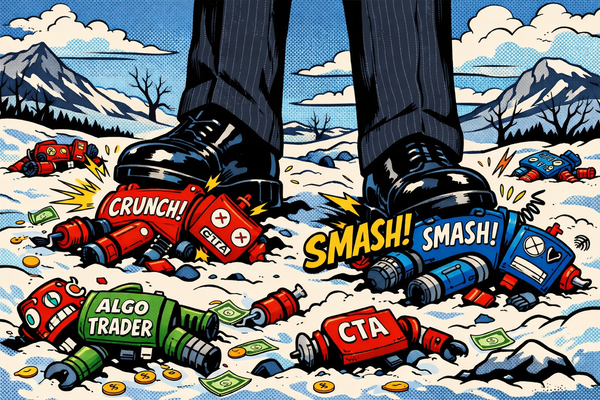
Chart Deck
Algo traders take a breath after being taken to the cleaners
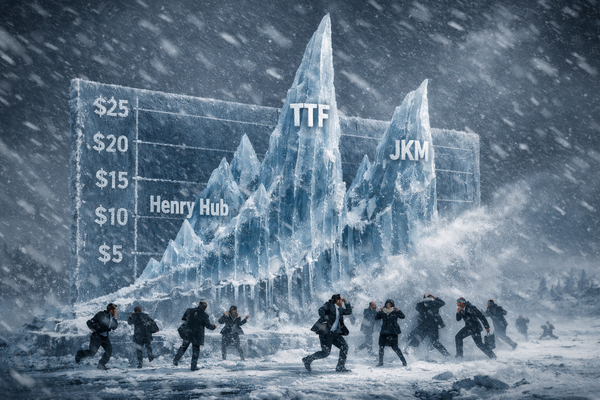
Chart Deck
Self-reinforcing volatility loop sustains sudden winter gas price rally, but for how long?
Hot take
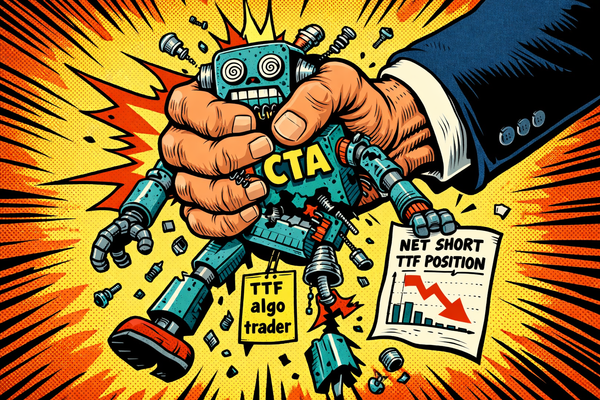
Hedge funds punish complacency in EU gas market. This is a sign of the times.
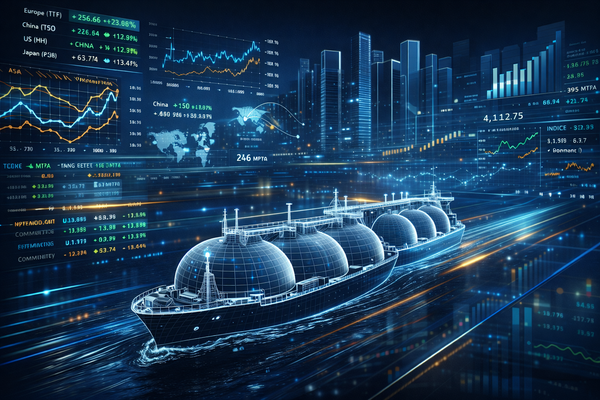
Chart Deck
New LNG physical balance index monitors glut conditions in real-time | Chart Deck — 19 Dec 2025