Chart Deck
TTF to the moon?
EU gas price surges past €60 per MWh. But is the top already in?
A weekly visual briefing on gas and LNG market dynamics, published every week in PDF and PPSX formats. The Chart Deck is home to the TTF Risk Model, TTF Sentiment Tracker, Storage-Speculation Nexus regression model and other proprietary analysis of benchmark pricing, arbitrage economics, speculative capital flows and physical trade flows. Available exclusively to subscribers on the Chart Deck and Premium subscription tiers. Latest issues below 👇

Chart Deck
EU gas price surges past €60 per MWh. But is the top already in?
Chart Deck
Diplomacy has taken the back seat in the clown car. Markets have stopped laughing and started buying
Chart Deck
“After four months of paralysis, the relief is palpable. It may also be misleading. And it is almost certainly temporary.” – Energy Flux, 26 June 2026 Well, that didn’t last long. Barely three weeks into a supposed two-month ceasefire, US missiles and Iranian drones are criss-crossing the Persian

Chart Deck
Iran holds the valve, but it is worth less every time it turns... so Tehran is reaching for the gun.
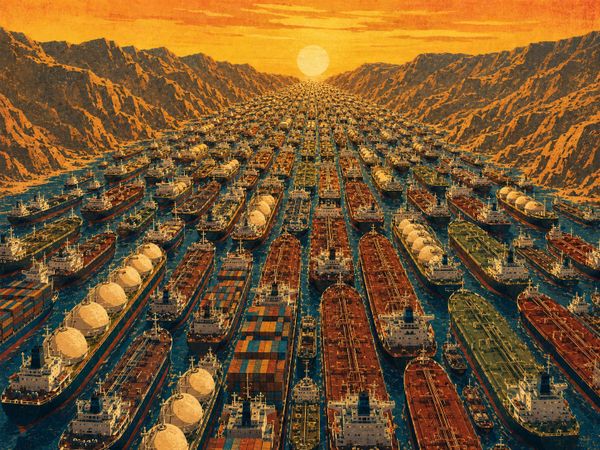
Chart Deck
Markets have priced the US–Iran ceasefire as a fully-fledged peace deal. The 60-day clock, and our models, suggest otherwise.
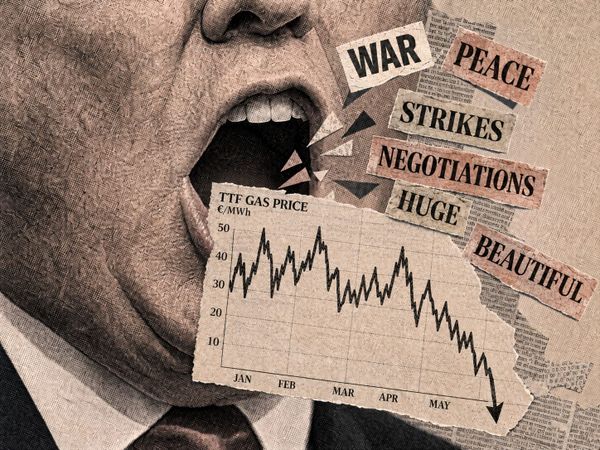
Chart Deck
Credulous energy markets have stopped pricing Iran, and started pricing Trump’s presidential word salads instead. This cannot end well.

Chart Deck
The hard risk budget cap keeping TTF below €50 has lifted. What remains is softer, stranger and harder to trade: a market with room to rally, but no-one willing to push through.

Chart Deck
Atlantic LNG is heading east. EU storage refill is falling behind. And TTF keeps stalling below €50/MWh. This week’s Chart Deck explains why this apparent equilibrium is as soft as melting butter.

Chart Deck
The gas market is no longer pricing a clean Hormuz reopening. It is pricing something messier: conditional transit, shifting LNG flows, nervous funds, and a shortfall in European gas storage injections.

Chart Deck
Prolonged closure jacks up near-term volatility, and sets the stage for an abrupt reversal: macroeconomic shock + demand destruction + new LNG supply wave

Chart Deck
For 55 days, the war-shocked global LNG market has been balanced by Asian state buyers going without. One just said, enough is enough.
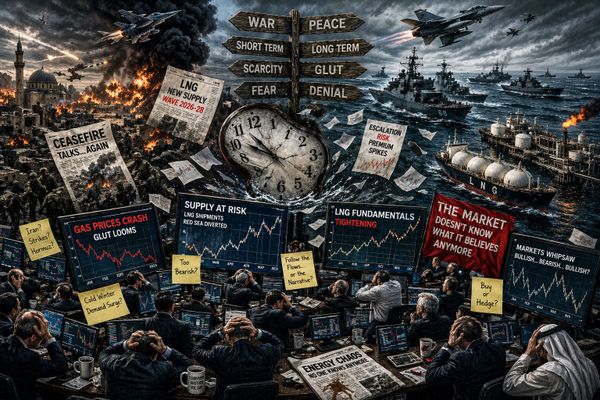
Chart Deck
Does the mispricing thesis still hold water? Either the data is wrong, or the market is.