
Chart Deck
Turning point?
Hedge funds are tempering bullish bets on European gas prices. Is this a momentary blip, or a change of direction? | EU LNG Chart Deck: 2 September 2024
A weekly visual briefing on gas and LNG market dynamics, published every week in PDF and PPSX formats. The Chart Deck is home to the TTF Risk Model, TTF Sentiment Tracker, Storage-Speculation Nexus regression model and other proprietary analysis of benchmark pricing, arbitrage economics, speculative capital flows and physical trade flows. Available exclusively to subscribers on the Chart Deck and Premium subscription tiers. Latest issues below 👇

Chart Deck
Hedge funds are tempering bullish bets on European gas prices. Is this a momentary blip, or a change of direction? | EU LNG Chart Deck: 2 September 2024

Chart Deck
European gas markets price in supply disruptions that might not happen. A steep correction is long overdue | EU LNG Chart Deck 5-9 August 2024
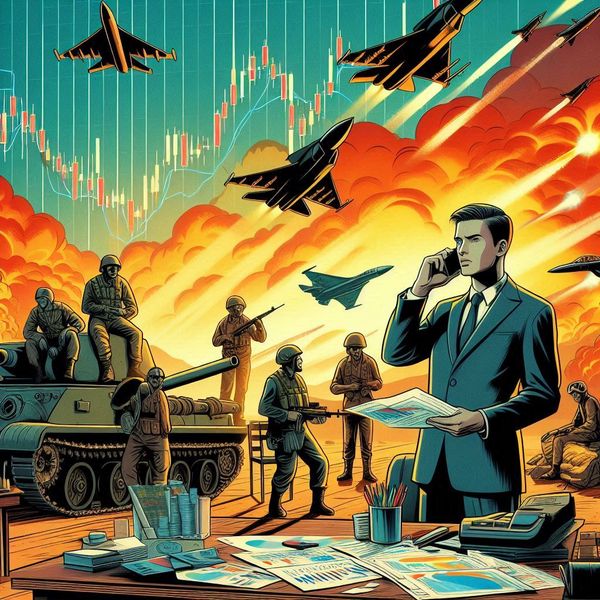
Chart Deck
Why WW3 would not be ‘bullish for gas’ | EU LNG Chart Deck 29 July-2 August 2024

Chart Deck
Financial manoeuvring and political machinations trump physical realities in gas price formation | EU LNG Chart Deck 13 May-14 June 2024

Chart Deck
Gas markets enter new bullish phase amid Golden Pass LNG debacle & OMV’s mysterious court ruling | EU LNG Chart Deck 13-24 May 2024
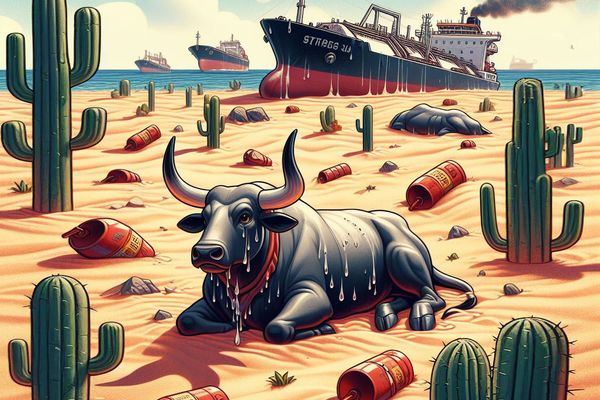
Chart Deck
Searing temperatures in Asia and LNG supply disruptions buoy EU gas prices. But for how long? | EU LNG Chart Deck 29 Apr-10 May 2024

Chart Deck
Either way, demand will plateau just as global supply surges | EU LNG Chart Deck: 28 Mar-26 Apr 2024

Chart Deck
Europe’s energy emergency is simultaneously alive and dead | EU LNG Chart Deck: 11-28 Mar 2024
Chart Deck
Widening gulf between LNG spot prices and oil-indexed contracts is squeezing sellers | EU LNG Chart Deck: 4-8 Mar 2024

Chart Deck
Oversupplied LNG market shrugs off canal outages | EU LNG Chart Deck: 19 Feb-1 Mar 2024
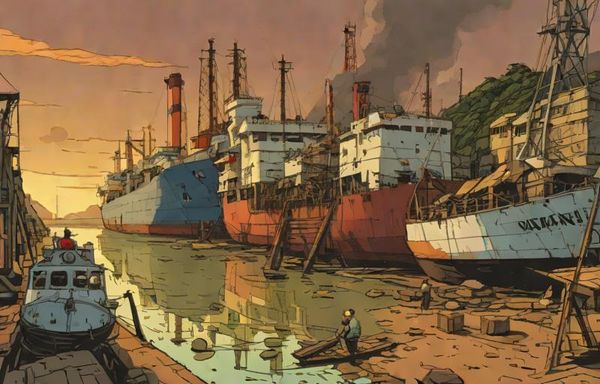
Chart Deck
Canal drought leaves US LNG exporters facing tricky choices | EU LNG Chart Deck: 5-16 Feb 2024
EU LNG Chart Deck
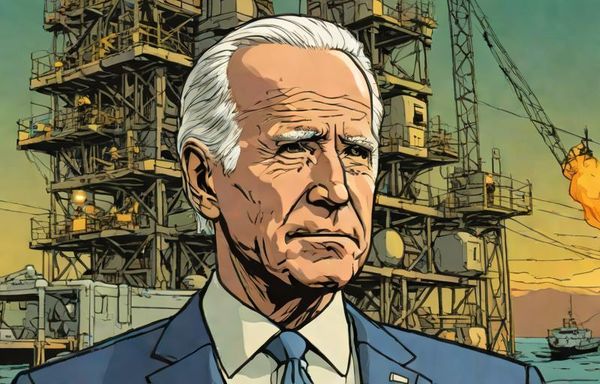
Global gas markets shrug at Biden’s US LNG 'pause' | EU LNG Chart Deck: 29 Dec 2023-2 Feb 2024