
War profits, quantified
As Middle East regional war upends global gas markets, US LNG exporters and traders stand to pocket a multi-billion-dollar windfall


The Strait of Hormuz is closed. Qatari exports are shut-in. Missiles are raining down across the Middle East… and the profitability of US LNG is sky-rocketing.
As the US-Iran conflict escalates, European gas and Asian LNG prices are surging. QatarEnergy declared force majeure on its LNG exports on 2 March after liquefaction facilities were damaged by an Iranian drone strike.
Without a clear timeline for repairs, the market is scrambling to reprice uncertainty. And the rally is showering additional export value for US LNG volumes entering Europe and Asia.
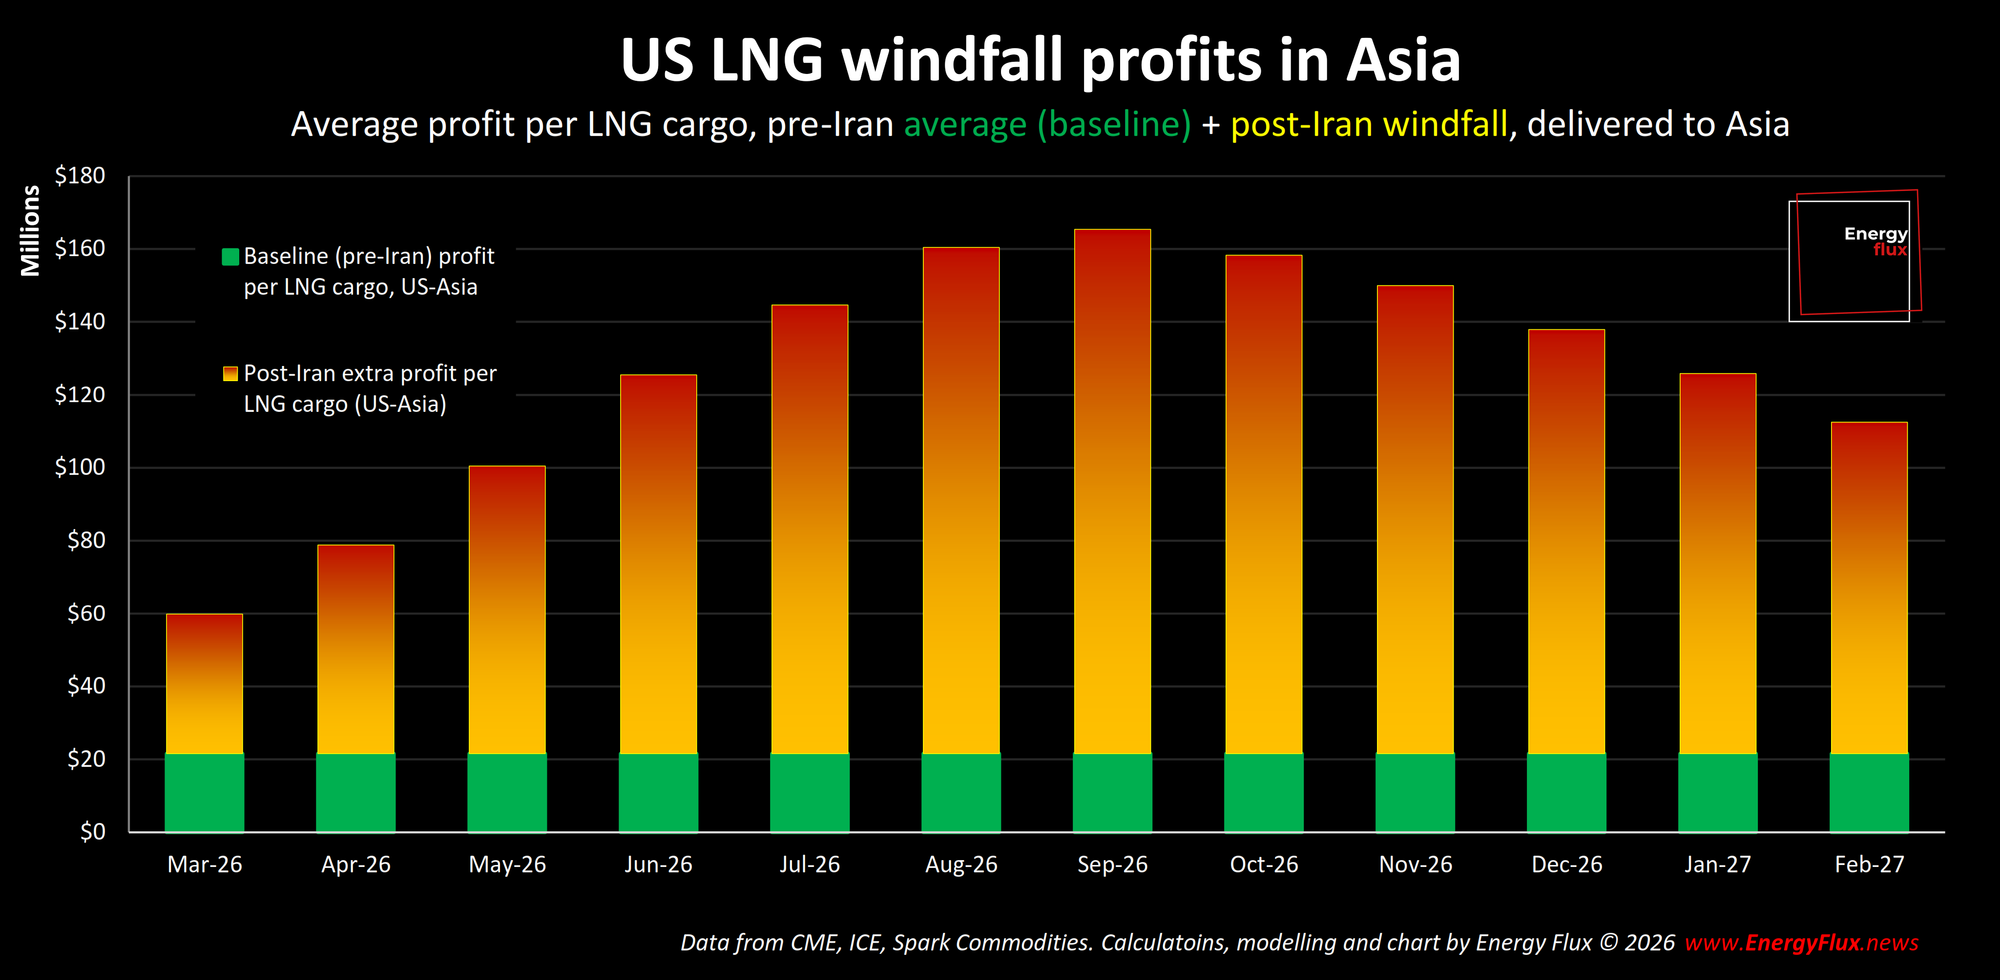
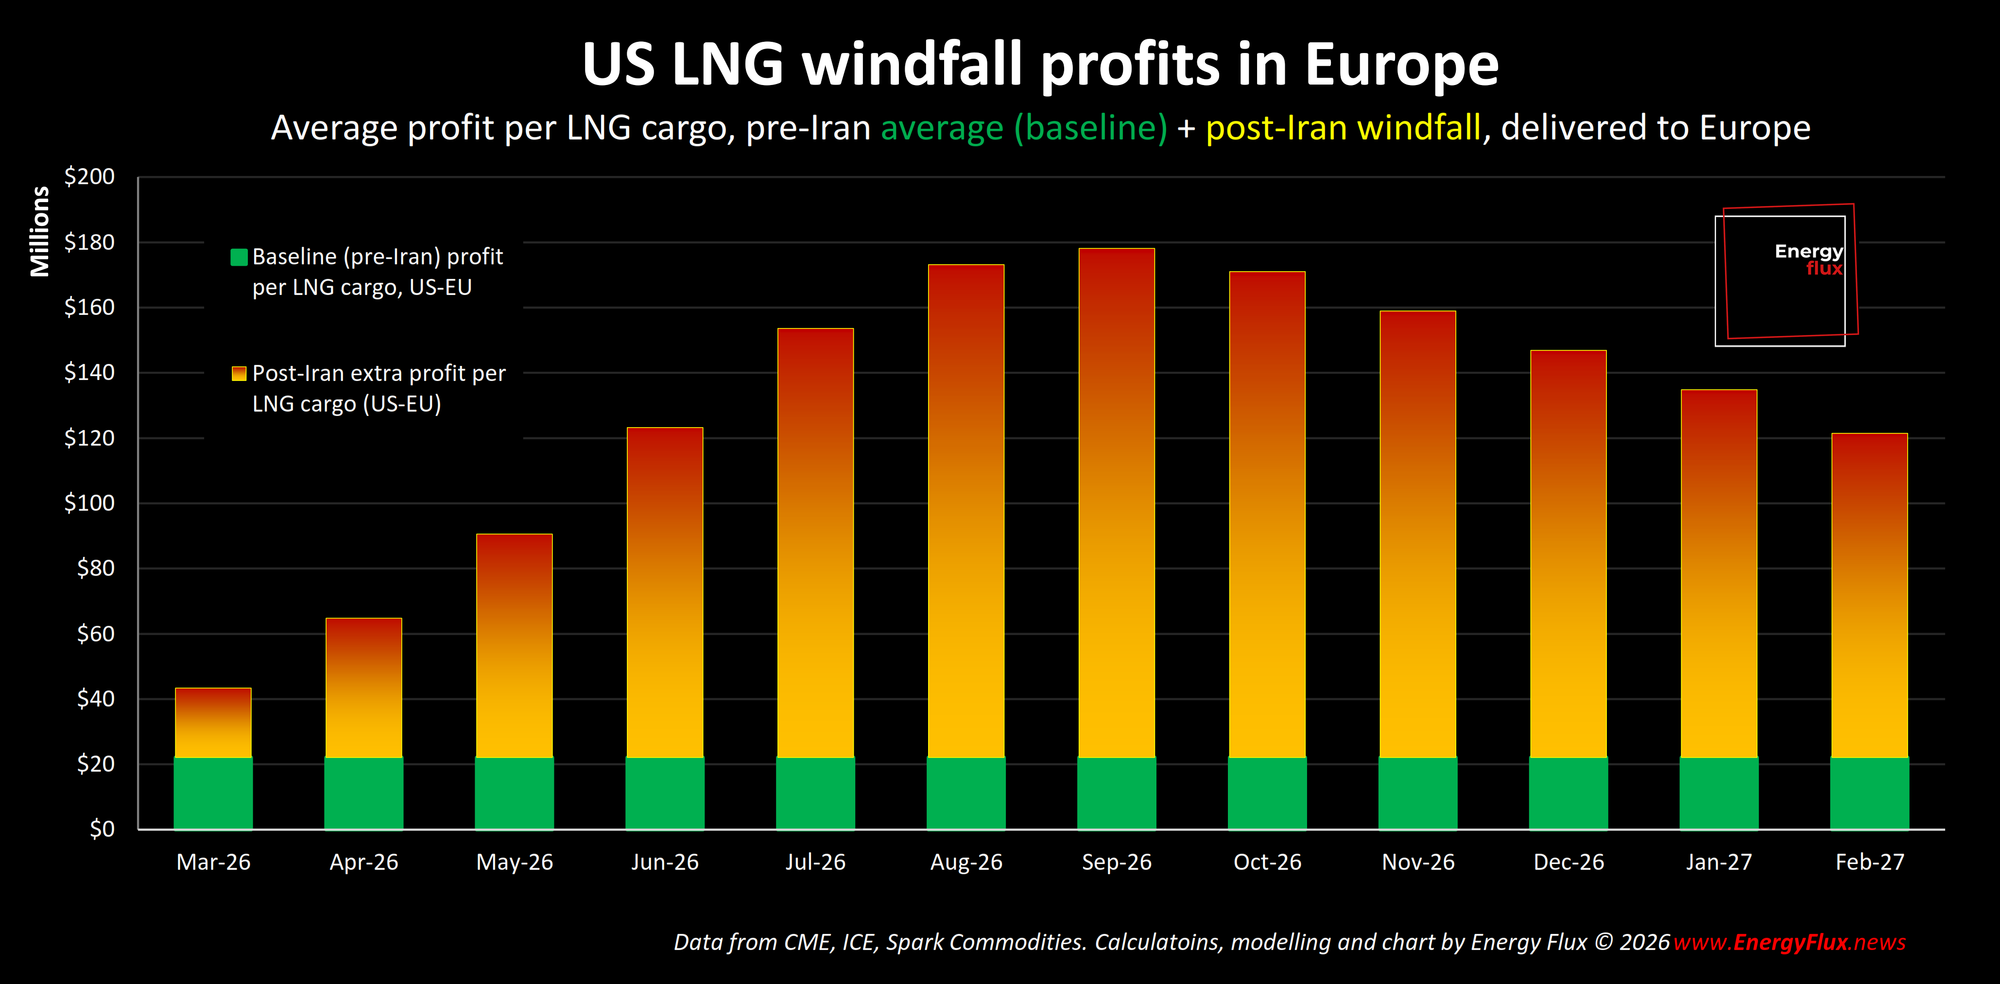
The nominal profit margin of a single LNG cargo delivered into Europe jumped from ~$25 million last week to more than $50 million as of 2 March, according to Energy Flux calculations. US LNG profits in Asia also spiked.
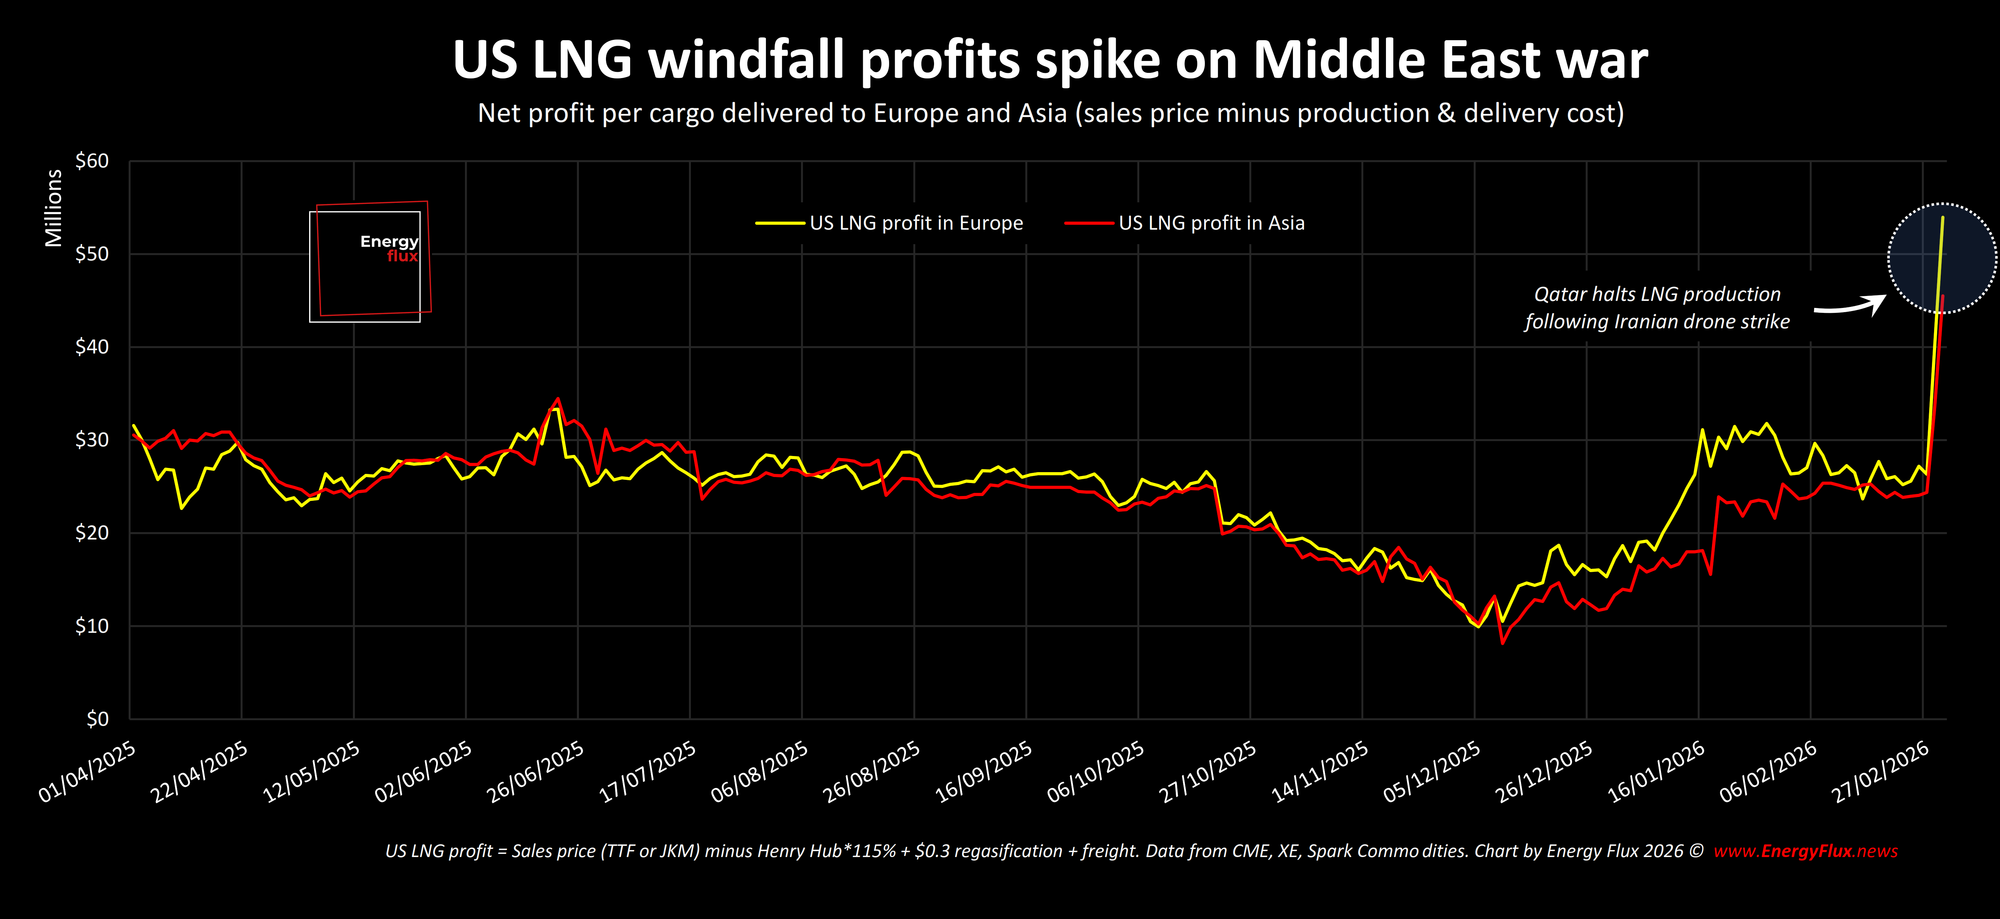
Based purely on today’s prices, exporters and traders of American LNG are set to accumulate roughly $870 million per week in additional margin above their pre-crisis baseline. And that rate is climbing.
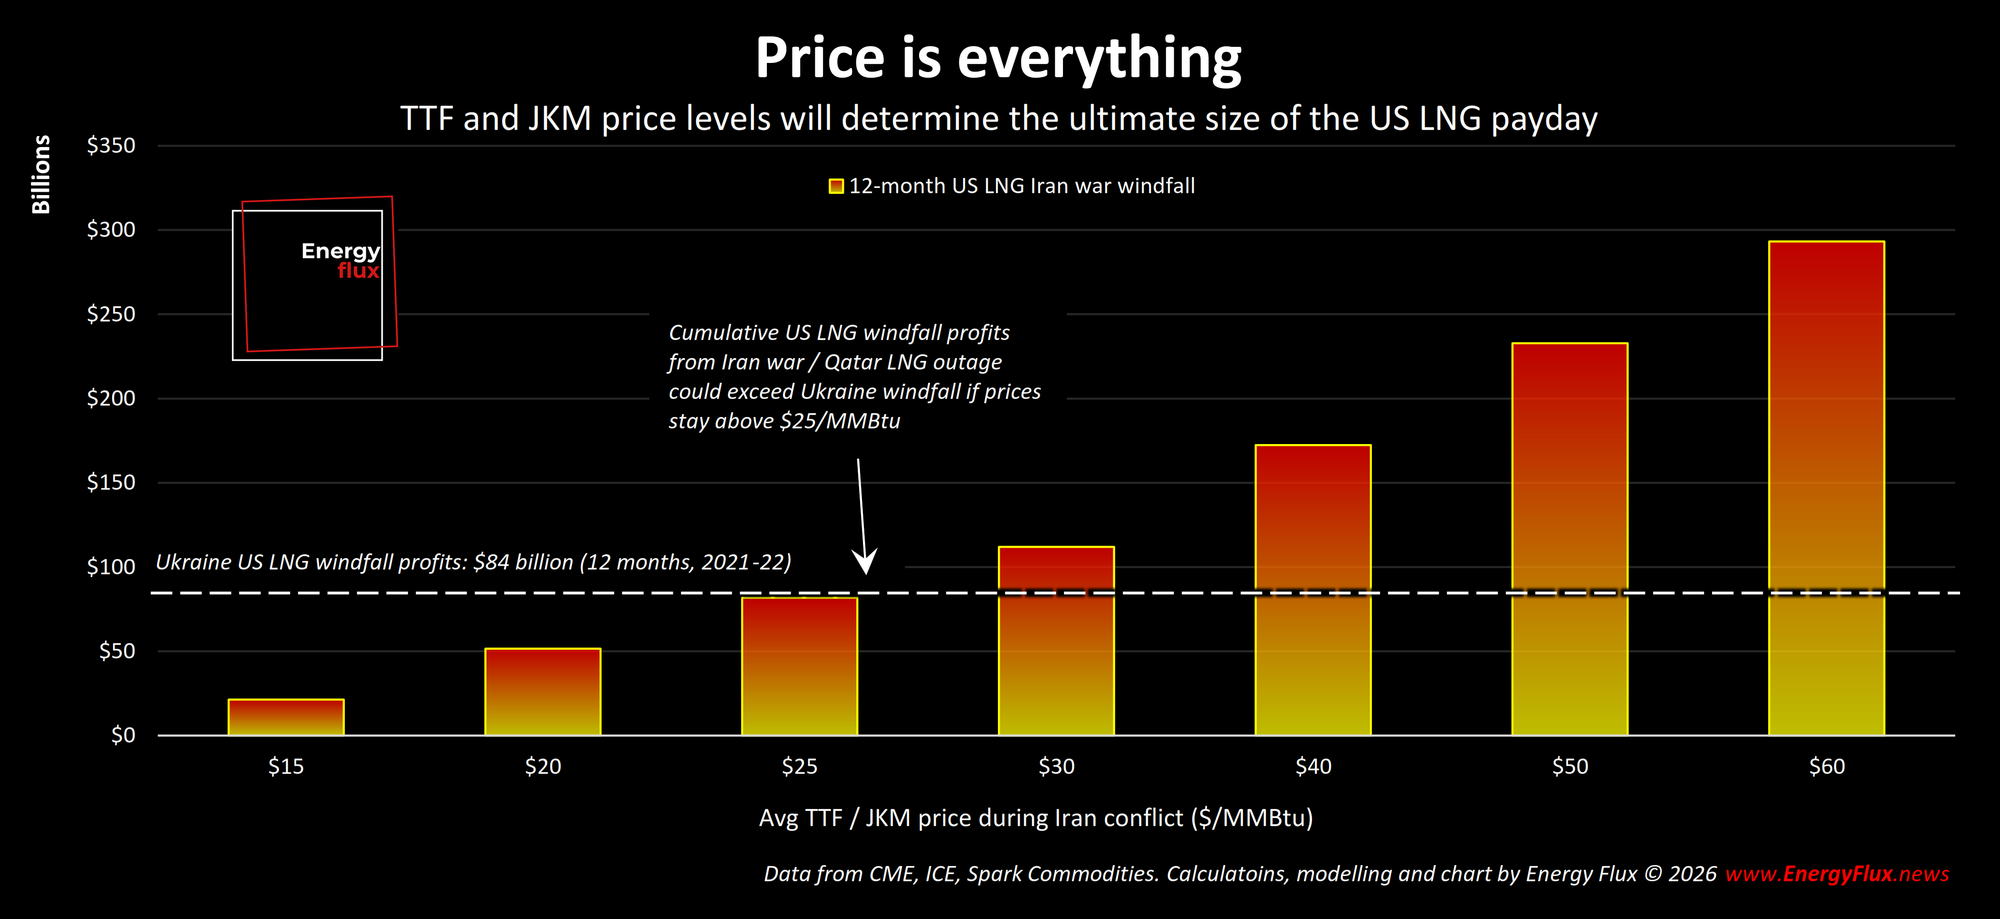
The scale of potential gain depends almost entirely on one variable: duration.
New data modelling by Energy Flux estimates that American LNG exports could generate up to $4 billion in windfall profits if the force majeure remains in effect for one month.
This figure could rise as high as $20 billion per month if the market is deprived of Qatari supply until the summer.
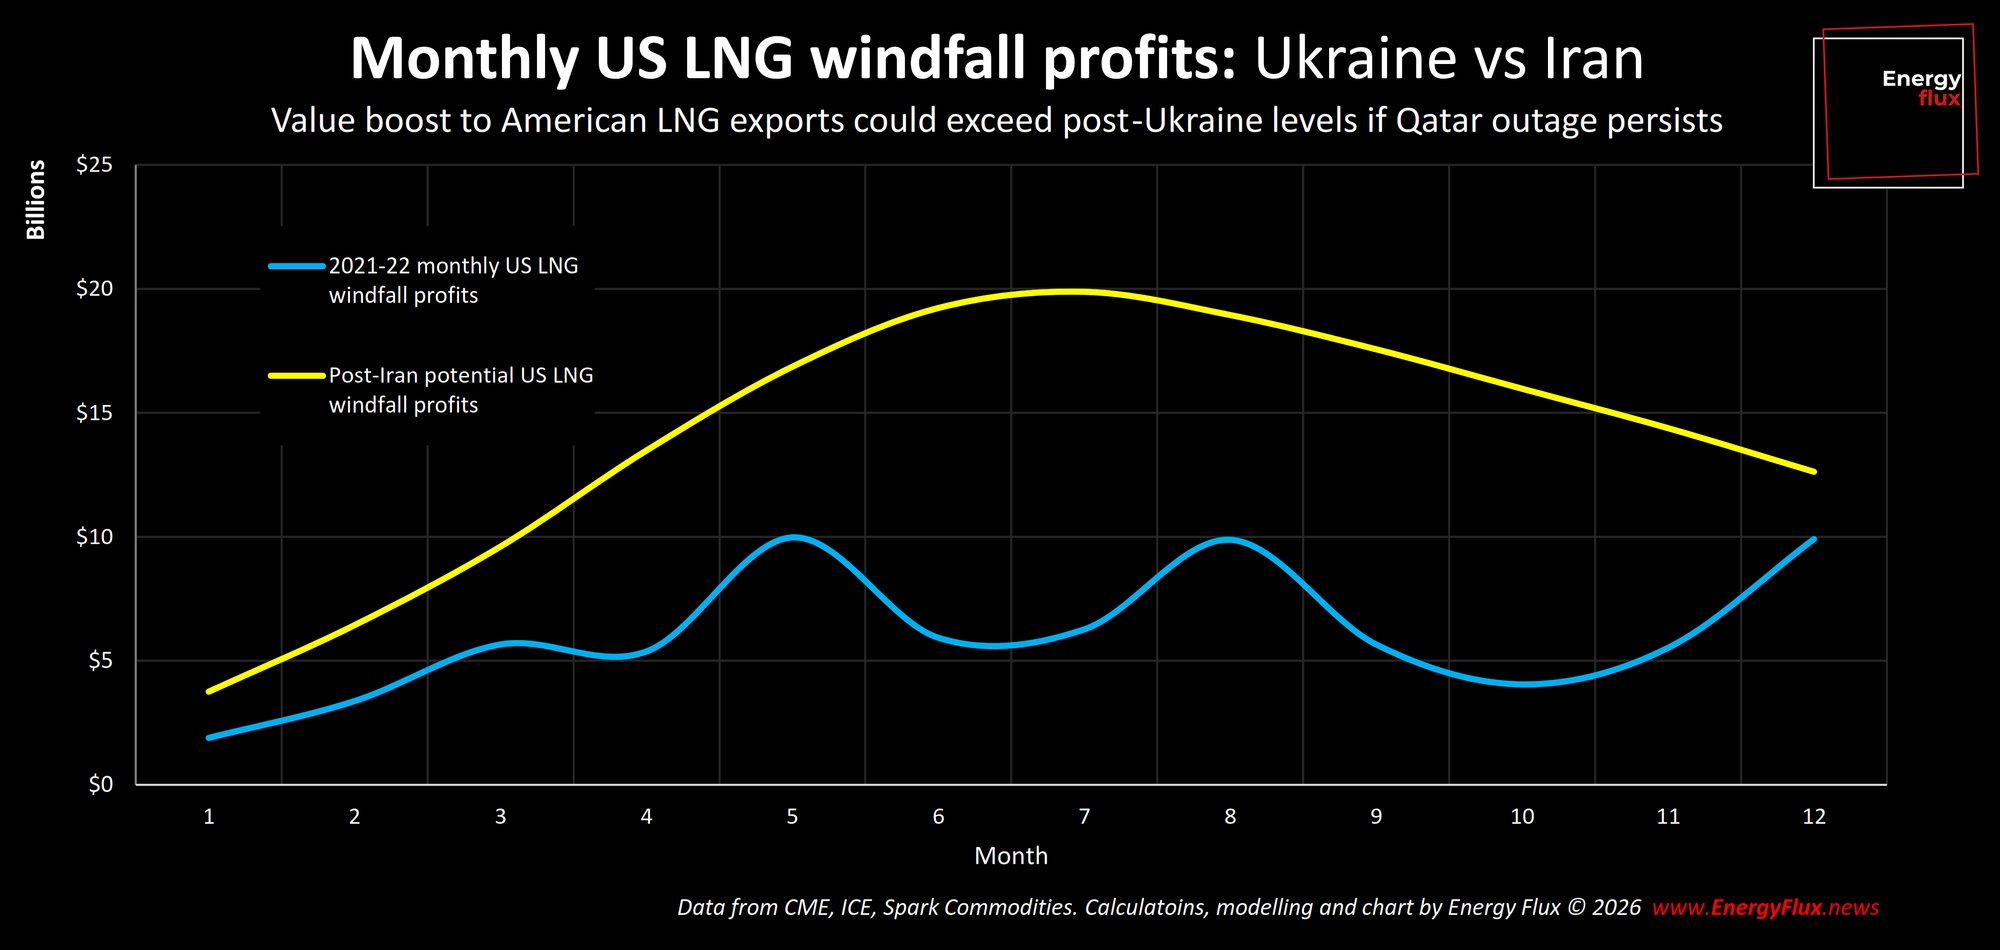
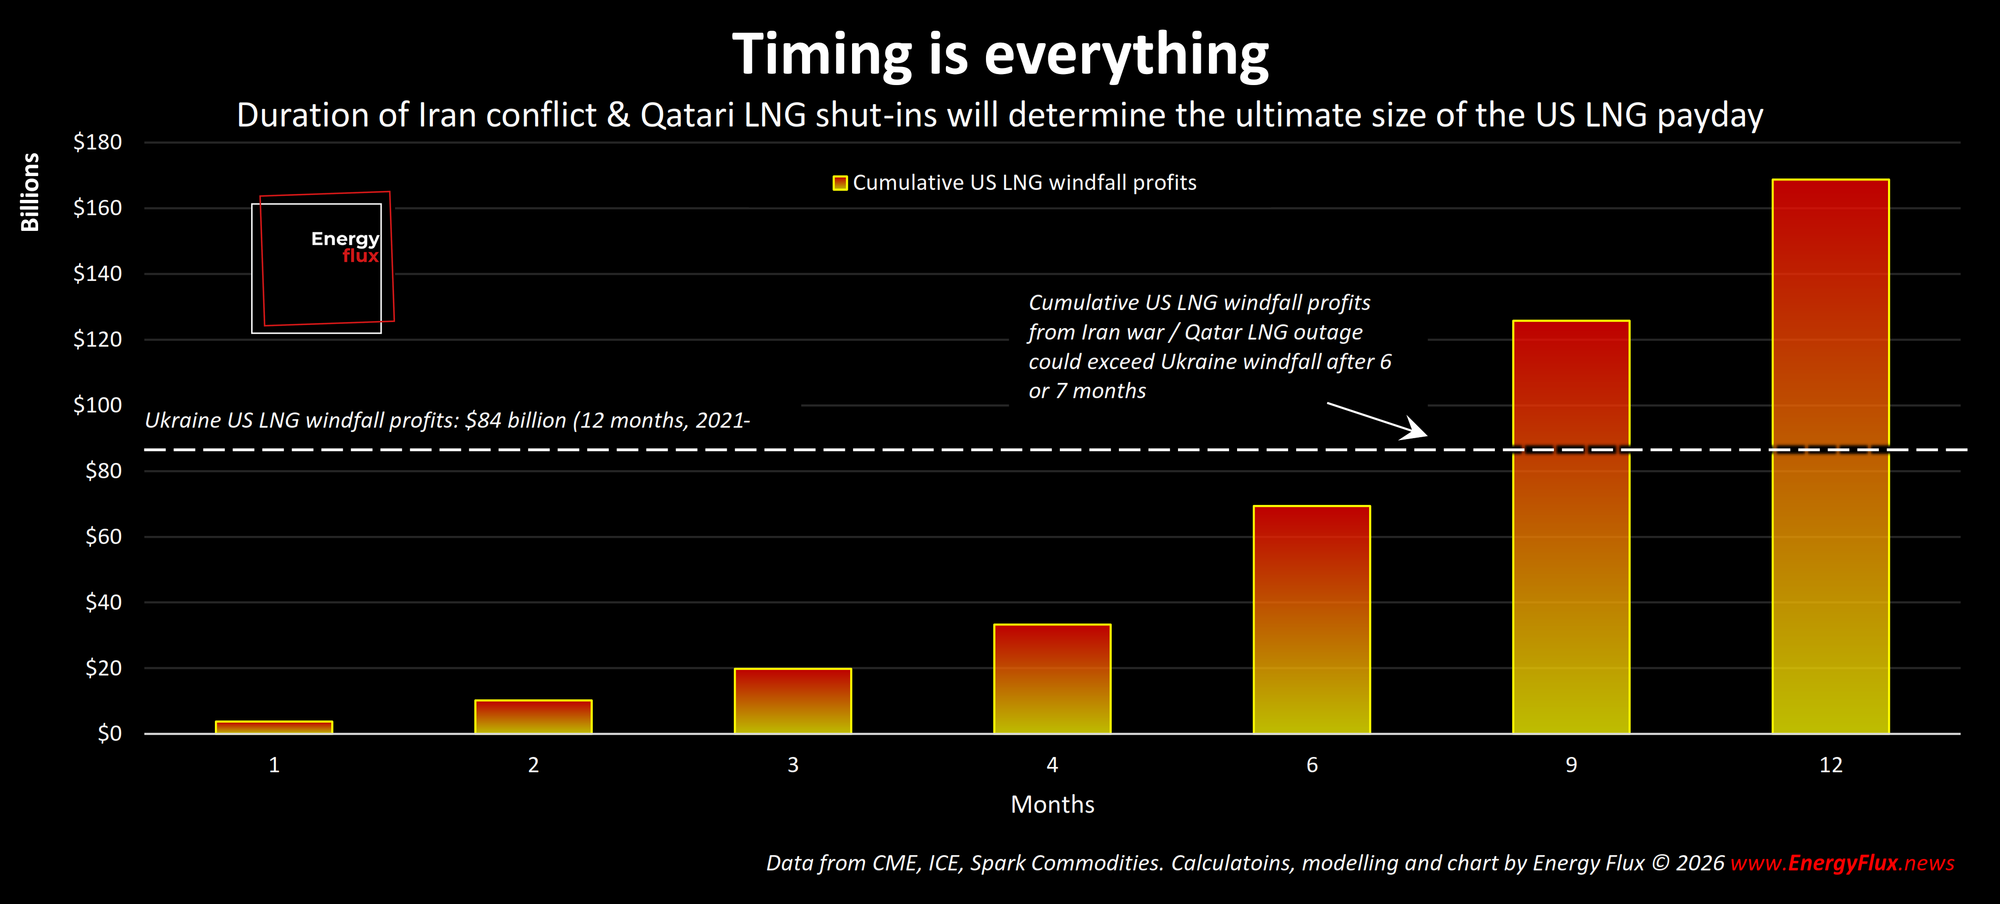
Cumulatively, US LNG war profits rise sharply the longer the Middle East conflict drags on, as prices spiral on physical tightening of global balances.
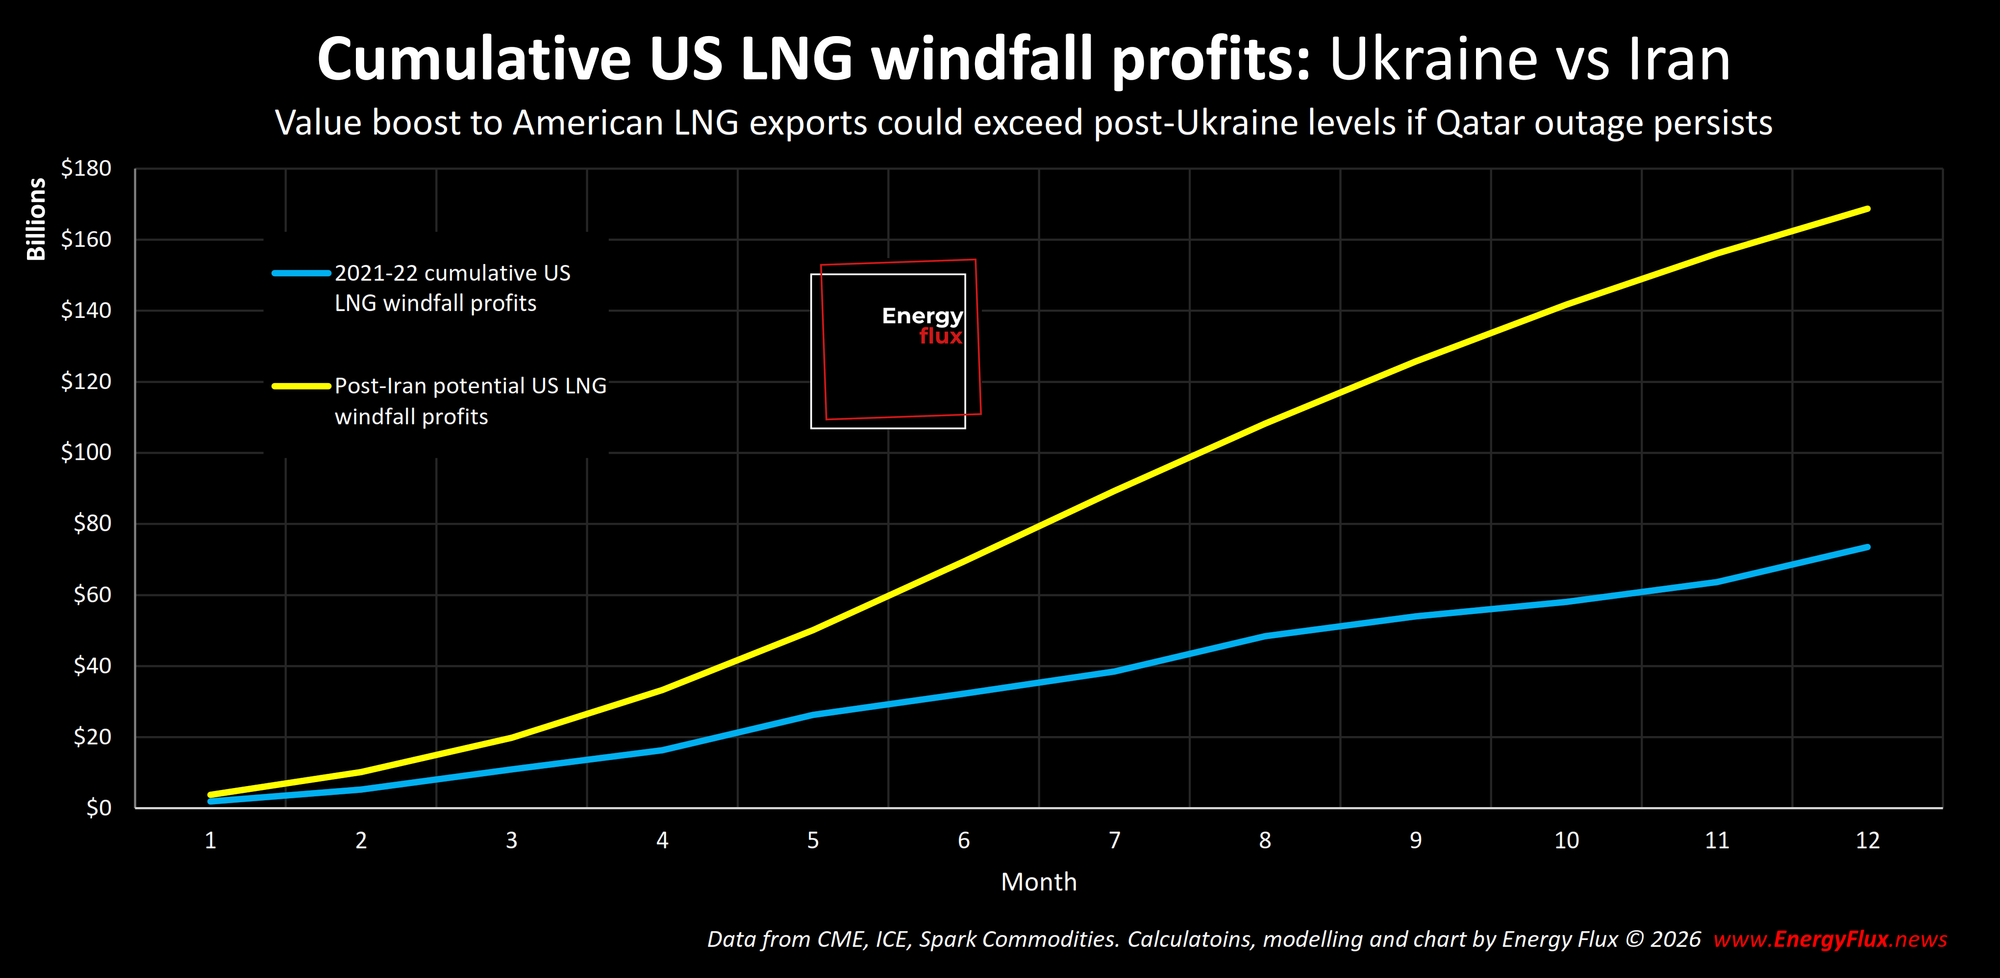
Over the first four months, US LNG profitability could reach more than $33 billion above the pre-Iran average. Over eight months, that figure rises to $108 billion.
And if, in an extreme scenario, Qatari LNG is shut-in for a full year, the excess profits raining down on US LNG traders could stack up to almost $170 billion — a figure that would represent one of the most concentrated commodity windfalls of the post-2000 era.
To put that in context, the 12-month Ukraine war windfall accruing to US LNG exports, from August 2021 through August 2022, is estimated at $84 billion. Iran could, in certain circumstances, eclipse that total in just over six months.

Qatar in a Strait jacket
Qatar’s LNG export terminals, with a nameplate capacity of ~80 million tonnes per annum (mtpa), were shuttered after being damaged in an Iranian drone strike. QatarEnergy’s declaration of force majeure dropped just as insurers withdrew war-risk insurance coverage for Strait of Hormuz transit, essentially closing the waterway to all commercial traffic.
Ships dropped anchor either side of the narrow maritime bottleneck, and Middle East hydrocarbon outflows slowed to a trickle.
The effects are only just starting to be felt in global commodity markets. TTF, the European gas benchmark, rallied 70% in two days to settle at €54/MWh ($18.60/MMBtu) on 3 March.
The price action was even more dramatic in Asia, the primary destination for Qatari LNG. Platts JKM, the spot LNG benchmark, spiked 96% over the same timeframe to hit $21/MMBtu for May’26 delivery. The extreme response reflects the market factoring in Asian buyers leaning on the spot market to replace lost Qatari supply during a prolonged Hormuz closure.
An immense wealth transfer from LNG importing economies to exporters and traders is looming. To gauge the size of the prize, Energy Flux developed a bespoke War Profits Model to test various assumptions and scenarios.
The model assumes European and Asian prices will nearly triple from today’s levels before demand destruction and partial supply responses begin to cap the rally. The model is downloadable and can be modified by users to test different geopolitical outcomes.
To be clear, it models worst-case scenarios that may or may not materialise. There are myriad reasons for the most extreme eventualities to be averted, not least the political incentive to avoid another energy inflation cost spiral.
The model gauges the size of US LNG netbacks under certain scenarios and price assumptions. It does not seek to establish who is in line to benefit from windfall profits. This is determined by contractual arrangements.
US LNG exporters with exposure to the spot market, such as Venture Global, are primed to benefit handsomely. But others, which sell most or all of their volumes under long-term Henry Hub cost-plus sales and purchase agreements, less so. In this case, their customers – traders, oil and gas majors, and utilities – will capture the higher rents accumulating from the loss of Qatari LNG.
The model establishes the baseline profitability of US LNG before and after the Qatari FM declaration, and calculates the difference between the two as the windfall. Who ultimately benefits is a function of this market structure, and is outwith the scope of the model.
This model is not a forecast, but an interactive tool. Premium subscribers can download it, explore the full methodology, and modify the inputs around their own assumptions about how the Middle East war will unfold across energy markets (download link at end of article).
Get the full picture with instant access: upgrade your subscription to Premium 👇
💥 Article stats: 2,800 words, 11-min reading time, six charts, 1 downloadable data model
Methodology: How the model works
The Energy Flux War Profits Model is built around a standard LNG netback calculation. For each month in the 12-month projection window, it computes the revenue a US LNG exporter earns from selling a standard cargo into Europe (priced at TTF) or Asia (priced at JKM), after deducting the cost of Henry Hub feed gas (multiplied by 115% to account for liquefaction fuel use), and freight costs to each destination.
A standard cargo is assumed to be 3.74 million MMBtu (equivalent to a 160,000 cubic metre LNG carrier). Monthly cargo counts are derived from actual EIA export volume data: 500 Bcf per month in 2026, split 50% to Europe and 37% to Asia (with the remainder going to other markets). These destination splits reflect the actual 2022 pattern, when the Ukraine crisis redirected US supply heavily toward Europe while Asia Pacific remained a strong secondary destination.
Windfall is defined as the per-cargo profit above the pre-crisis baseline, multiplied by total cargo volumes. The pre-Iran baseline is derived from actual weekly market data across the six months preceding the force majeure declaration, from 1 September 2025 to 1 March 2026. This gives a baseline EU cargo profit of $22.1 million and a baseline Asia cargo profit of $21.6 million per cargo, reflecting the relatively modest netbacks available at pre-crisis price levels.
The Ukraine benchmark figures are calculated using the same methodology applied to actual historical price data. Both the baseline period (24 February to 23 August 2021) and the crisis period (24 August 2021 to 23 August 2022) are derived from real weekly market observations, making these genuinely comparable data points rather than modelled estimates.
The Ukraine benchmark: putting the numbers in context
The most useful reference point for the Iran scenario is the Ukraine war cycle of 2021-22, which produced the last major LNG windfall for American exporters and remains the most thoroughly documented gas crisis of recent times.
Calculating Ukraine-era windfall accurately requires care. Russia did not wait for the February 2022 invasion to begin manipulating European gas markets. From mid-2021, Gazprom began systematically reducing pipeline flows to Europe, driving TTF from less than €30/MWh ($10/MMBtu) to nearly €90/MWh ($30/MMBtu) before the first Russian tank crossed the Ukrainian border.
The Energy Flux model therefore uses a clean baseline period of 24 February to 23 August, 2021 — six months of relatively undistorted market conditions before the Russian manipulation began. The Ukraine crisis period runs from 24 August 2021 to 23 August 2022, spanning both the six-month pre-invasion manipulation phase and the 6-month post-invasion price spike. Over this window, the average profitability of a single US LNG cargo delivered to Europe rose from $16.6 million at baseline to $101.8 million during the crisis. The average per-cargo windfall (profitability minus baseline) was thus $85.2 million on European deliveries.
Under this methodology, the total 12-month Ukraine windfall accruing to US LNG exports is estimated at $83.7 billion. Against that benchmark, the Iran war windfall scenario is twice as large over a comparable 12-month horizon, at $168.7 billion.
Three structural factors explain the difference:
- US LNG export capacity has grown materially since 2021-22, adding roughly 2.4x Asia-bound cargo volume and 1.3x European capacity.
- The pre-Iran baseline is lower than pre-Ukraine, meaning the gap between normal and crisis conditions is wider.
- The projected escalation in EU and Asian prices, while more conservative than the extremes of the Ukraine cycle, is applied to a larger and more globally-integrated US export base.
At the Iran scenario’s average monthly windfall rate of $14.1 billion per month, it would take approximately six months of sustained disruption for cumulative Iran windfall to exceed the entire Ukraine 12-month total.
Core assumption & rationale: TTF/JKM price escalation
The most consequential element of the model is the price escalation schedule: the assumed path for TTF and JKM prices across the 12-month projection window. Unlike the Ukraine analysis, which uses observed market prices, the Iran scenario requires forward assumptions about how gas markets will evolve. These assumptions are disclosed in full and are deliberately conservative relative to the Ukraine price experience.
- Month 1 (March 2026): TTF $18.50/MMBtu. This is a modest step up from the ~$17 current price on 3 March. The immediate market response is muted as participants assess the initial disruption and inventory drawdowns begin. Charter markets and shipping routes are already repricing.
- Months 2–3 (April–May 2026): TTF $25–$33/MMBtu. The supply gap becomes undeniable. European storage refill season is underway, competition for LNG cargoes intensifies, and freight costs rise sharply as Atlantic Basin cargoes ship longer routes to Asia to capture higher netbacks, tightening freight market tonnage.
- Months 4–7 (June–September 2026): TTF $43–$60/MMBtu. The model’s central case peaks at $60/MMBtu in September 2026 (approximately €180/MWh). TTF surges ahead of JKM, as the EU gas restocking challenge becomes acute. For context, TTF peaked at around $90/MMBtu (nearly €280/MWh) during the August 2022 Ukraine crisis. The Iran TTF price peak is assumed to be lower on the basis that European demand has fallen materially since 2022. This is a deliberately conservative assumption.
- Months 8–12 (October 2026–February 2027): TTF $58–$42/MMBtu. Demand destruction in European industry, partial supply substitution from other LNG producers, and potential diplomatic progress all weigh on prices. The model shows a gradual descent toward $42/MMBtu by month 12, still elevated relative to pre-crisis levels but no longer in full-blown crisis territory.
Henry Hub is assumed to rise in parallel: from $3.04/MMBtu today toward a peak of $6.50/MMBtu in the model’s central case, reflecting rising US domestic gas demand from LNG facilities running at capacity and some pull-through from global price signals. Higher HH prices reduce netback margins, so a more elevated domestic price path would modestly compress the windfall figures shown here.
Users of the model can modify the entire escalation schedule freely. The model is explicitly designed to allow scenario testing. A more bearish price path — say, a swift diplomatic resolution within two months and TTF peaking at $25/MMBtu — produces drastically different results. So does a more bullish one. The numbers presented here represent one plausible central case, not a range of outcomes. That range is captured in the sensitivity analysis.
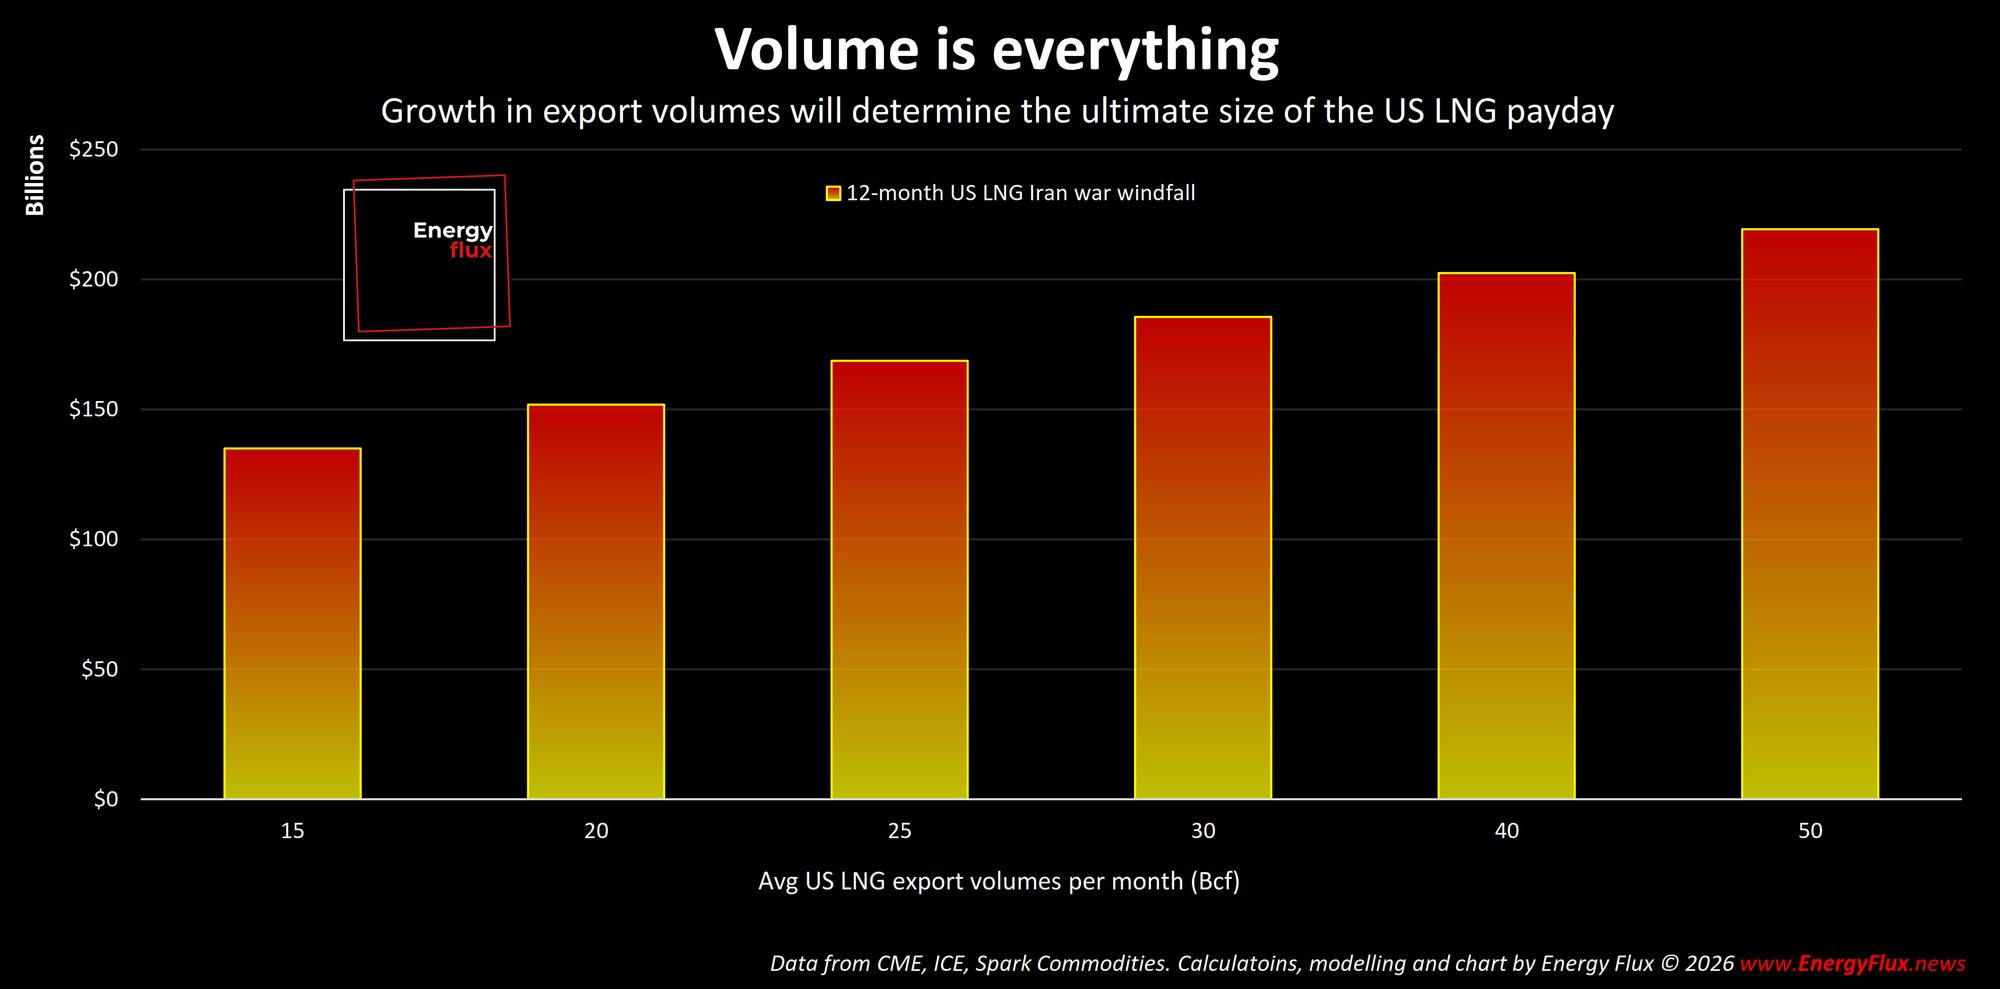
Sensitivity analysis: Iran US LNG windfall profits under differing price, duration and export volume scenarios
Important caveats: what the model shows, and what it omits
The figures above are the output of a quantitative model, not a market forecast. They are designed to answer a specific, bounded question: given reasonable assumptions about how European and Asian prices might evolve during a sustained Qatari supply disruption, what additional gross profit would flow to US LNG exporters above the pre-crisis baseline?
The model is deliberately transparent about what it captures and what it does not.
It captures the netback economics of exporting a standard LNG cargo — destination price minus Henry Hub feed gas cost, minus liquefaction toll, minus freight — applied to actual US export volumes and destination splits. Everything else is excluded by design.
What the model does not capture is equally important.
- It makes no allowance for demand destruction at high prices, which would be substantial in European industry above $50/MMBtu.
- It assumes no meaningful competing supply response from Australia, Norway, Russia or other producers, all of which would divert cargoes to premium markets and dampen the rally.
- It treats US LNG export volumes as constant at 500 Bcf per month regardless of price signals, which would not be the case in practice.
- And it calculates gross windfall (the additional revenue above the pre-crisis baseline), not net profit after taxes, hedging positions, corporate overhead, or royalties.
These are not apologies for the model. They are the necessary framing for any reader who wants to understand its limitations. The numbers represent a plausible upper bound: the windfall the market could deliver to US exporters under a sustained, unmitigated disruption.
Reality will probably land somewhere short of that, at a point determined by geopolitics, diplomacy, insurance markets, and demand elasticity. The model’s value lies not in predicting where that point is, but in quantifying the stakes.
Duration is everything
If there is a single variable that matters most in this analysis, it is the duration of the Strait of Hormuz closure and Qatari LNG outage. The sensitivity analysis makes this stark.
A one-month disruption generates $3.8 billion — significant, but within the noise of normal commodity market volatility. A three-month disruption yields $19.8 billion. At six months, cumulative windfall reaches $69.4 billion. The jump to a nine-month disruption — $125.8 billion — represents the point at which market structures begin to change: EU storage injections are subsidised or stall, and European industrial demand craters (again).
At 12 months, the $168.7 billion total represents something qualitatively different: a sustained structural shift in who captures value from global gas markets. It would be among the largest commodity windfalls in recent history, concentrated almost entirely in the United States and accruing principally to the operators and long-term offtakers of the six major US LNG export complexes: Sabine Pass, Corpus Christi, Cameron, Sabine Pass Train 6, Freeport, and Cove Point, together with the upstream gas producers whose molecules they liquefy.
The duration variable is, at present, entirely a function of geopolitics. A rapid diplomatic resolution could truncate the disruption within weeks and render the analysis presented here as moot. This would require Iranian assurances of non-interference with Strait of Hormuz traffic, and the restoration of war-risk insurance coverage.
The same outcome could result from sustained US Navy protection guarantees for commercial tanker traffic through the Strait (although this appears questionable as doubts swirl around the US Navy capacity to escort shipments).
In either case, accelerated repair of damaged Qatari export infrastructure is also a prerequisite.
Risk skewed to the upside
As of the date of this analysis, the geopolitical signals are not pointing toward rapid de-escalation.
Iran’s Islamic Revolutionary Guard today claimed full control of the Strait of Hormuz, in defiance of US president Donald Trump’s pledge to guarantee safe passage. Meanwhile, Iran’s violent scattergun response is provoking neighbours and drawing neutral parties into the war. At the same time, Israeli rhetorical pressure seeks to engage Europe in the conflict.
None of these developments necessarily leads to a full-blown regional war. History is full of crises that looked irreversible at their peak and resolved through back-channel diplomacy that was invisible to markets. The pattern of escalation and managed de-escalation has been the defining feature of Middle Eastern geopolitics for decades.
But the structural difficulty of putting this genie back in the bottle should not be underestimated. The QatarEnergy force majeure is not simply a logistical disruption; it is proof that the global LNG supply chain, which has operated with remarkable resilience since the first Qatar LNG trains came online in 1996, is now exposed to direct physical disruption at its most concentrated point.
Markets have not fully priced in the duration risk. TTF at ~$17/MMBtu on the day the force majeure was declared reflects a market that is digesting an unexpected event, not one that has concluded the disruption will be sustained. The escalation schedule in this model is an attempt to trace a plausible price path if the market progressively prices in a prolonged outage. The model does not predict that outcome. It quantifies the consequences if it occurs.
What we can say with confidence is that the economic incentive structure has shifted dramatically. US LNG exporters are now the marginal supplier for a significant share of global gas demand. The wider and longer the supply gap, the more extraordinary the rents they can extract. The market, in its present configuration, rewards the continuation of disruption with parabolic escalation.
How high will the windfall profits climb?
Download the model
The complete model is available for download to Premium subscribers, via the link below the paywall. It is built in Excel and is fully interactive: every assumption in the price escalation schedule, every volume figure, and every cost parameter can be modified directly.
The model includes a sensitivity analysis covering TTF price scenarios, disruption durations from one to twelve months, and export volume assumptions. A ‘Read Me’ tab explains the methodology, the editable inputs, and the key caveats in full.
To be clear and to reiterate: the model is an analytical tool designed to help readers understand the economic stakes of different scenarios. It is not a forecast, not a trading signal, and not a prediction of market outcomes. The assumptions driving the central case are disclosed and debatable.
The purpose is to equip readers with a framework for thinking about how geopolitical events translate into US LNG export economics, not to provide a definitive answer to a question that geopolitics has not yet resolved.
Seb Kennedy | Energy Flux | 4 March 2026
👇 MAKE IT YOURS: Download the Energy Flux War Profits Model (Premium subscription required) 👇

Member discussion: War profits, quantified
Read what members are saying. Subscribe to join the conversation.