After the squeeze
Algo traders take a breath after being taken to the cleaners


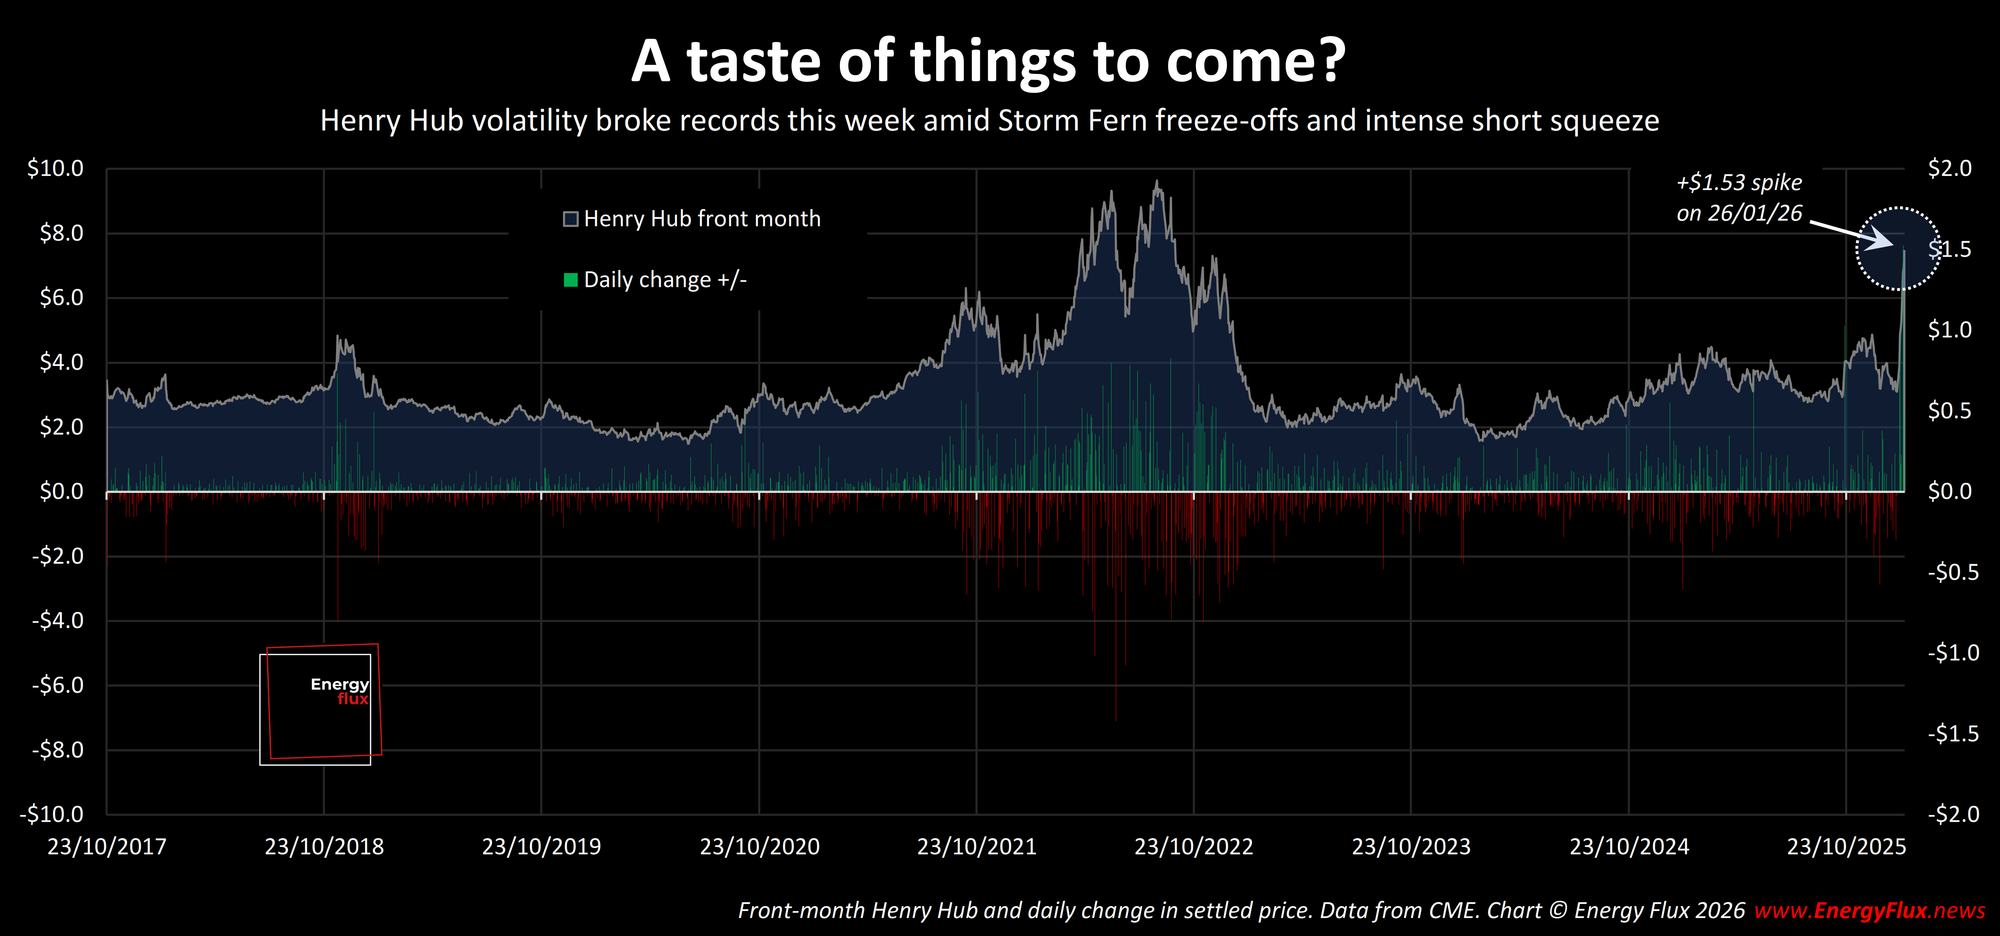
After a wild fortnight in global gas markets, the untethered escalation in American and European hub prices appears to be reaching its peak – for now.
The February-dated contract on Henry Hub, the US benchmark gas trading hub, expired on Wednesday at $7.46 per MMBtu – a rise of 140% over seven chaotic trading sessions – as Winter Storm Fern battered Gulf Coast states and rattled markets.
Sub-zero temperatures triggered a surge in power and heating demand and throttled US shale production, as wells, pipelines, compressor stations and gas-fired generators froze up.
Traders pounced on the rapid tightening in fundamentals to execute an intense squeeze on speculative short positions, driving the rally to highs not seen since 2022.
The most alarming aspect of this episode was the rate of change. The front-month settled price rose by a record $1.53/MMBtu (+22%) on Monday 26 January, marking a new high for daily price swings on Henry Hub.
Funds known as Commodity Trading Advisers (CTAs) that use algorithmically driven trading strategies to follow market momentum or price trends reportedly suffered heavy losses.
Many CTAs were betting Henry Hub would fall when extreme winter weather forecasts surfaced. As prices rose and the market moved against them, CTAs were caught short; forcing them to exit out-of-the-money positions and buy length to limit losses.
Citing data from Kpler, Bloomberg reported:
“Although it’s too soon to assess the total dollar-value of CTA losses, it’s becoming clear the sudden rally wiped out all their gains for the year and that the scramble to close short positions as prices were skyrocketing actually accelerated the rally.”

The parallels with the European gas market are striking. Dutch TTF, the European gas benchmark, shot up by ~40% over the previous two weeks when hedge funds executed a similar squeeze on CTAs holding short TTF positions.
The depth of that TTF short squeeze became apparent in the days after, as Commitment of Trader data revealed an historic repositioning in hedge fund net length. Fundamentals were the spark, but the whipsawing in speculative bets was the rocket fuel that turned a correction into a parabolic drama.
TTF prices have since calmed somewhat. The front month contract appears to have hit a ceiling just below €40/MWh ($13/MMBtu), although a fresh blast of cold weather in February could reignite speculative buying activity.
The most revealing aspect of this episode is what happened in the days since the initial TTF rally. This week’s subscriber-only Chart Deck takes a scalpel to the latest CoT, exchange, gas storage and LNG flow data to perform a post-mortem on the algo-traders and CTAs who were crushed by the sudden winter bull run.
The findings speak volumes about the immense structural risks now deeply embedded in gas markets in 2026.
Highlights:
- The biggest TTF short squeeze in CoT history: winners, losers and what drove it (slide 22)
- Funds flee TTF: prices stabilise as investment funds exit the market to lick their wounds (slides 23-24)
- TTF Sentiment Tracker signals moderately bullish as funds sell shorts but keep a lid on length (slide 20)
- Rapid storage depletion and fund aversion drags the TTF Risk Model further into bullish-underpriced territory (slides 33-36)
- Cargoes on the move: Europe’s sudden scarcity price signal prompts curious LNG vessel movements (slides 66-68)
- LNG is still glutting: rampant supply growth outpaces resurgent 2026 global LNG demand (slide 70, 83)
💥DOWNLOAD: 80+ slides in .ppsx and .pdf format
Volatility is loud. Signal is scarce. Get instant access to this week’s 80-slide Chart Deck and see what the positioning, flows and curves actually say — not what the market is shouting.

Member discussion: After the squeeze
Read what members are saying. Subscribe to join the conversation.