Pain threshold
DEEP DIVE: How low must LNG prices go to unlock Asian demand?

Everybody loves a bargain. But how cheap is cheap enough to lure Asian LNG buyers back to the market? And at what point does downward demand flexibility turn into demand destruction?
As Asian LNG demand growth falters in the face of a cresting global LNG supply wave, spot prices are softening. But will further declines spark the demand response that producers are counting on?
In a new data investigation, Energy Flux pinpoints where Asia’s pain threshold really lies and what it means for global energy markets on the cusp of profound supply-side transformation.
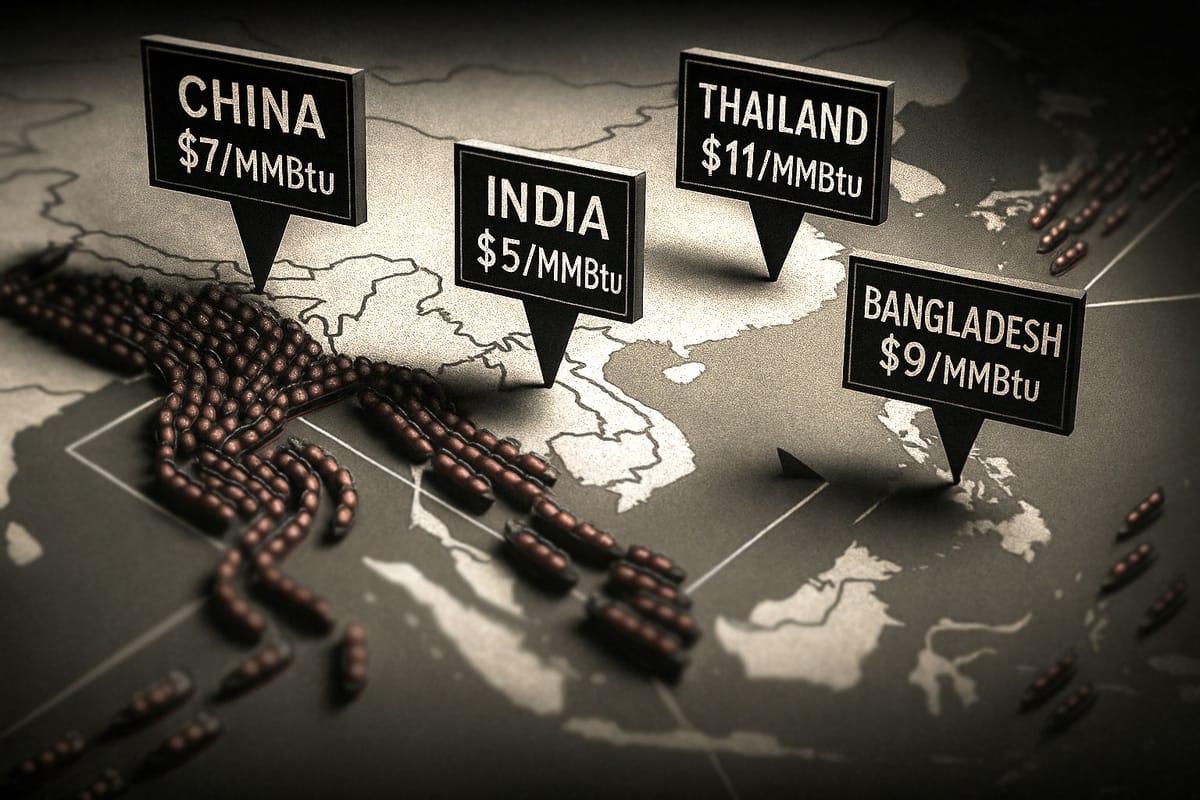
Using new analysis of Kpler LNG import data segmented by trade type across nine key Asian demand centres, this special reader-requested Deep Dive maps how different countries respond to price signals.
The result is a clear picture of where demand rises, where it collapses, and how that tipping point shifts between markets, socioeconomic indicators, and import profiles.
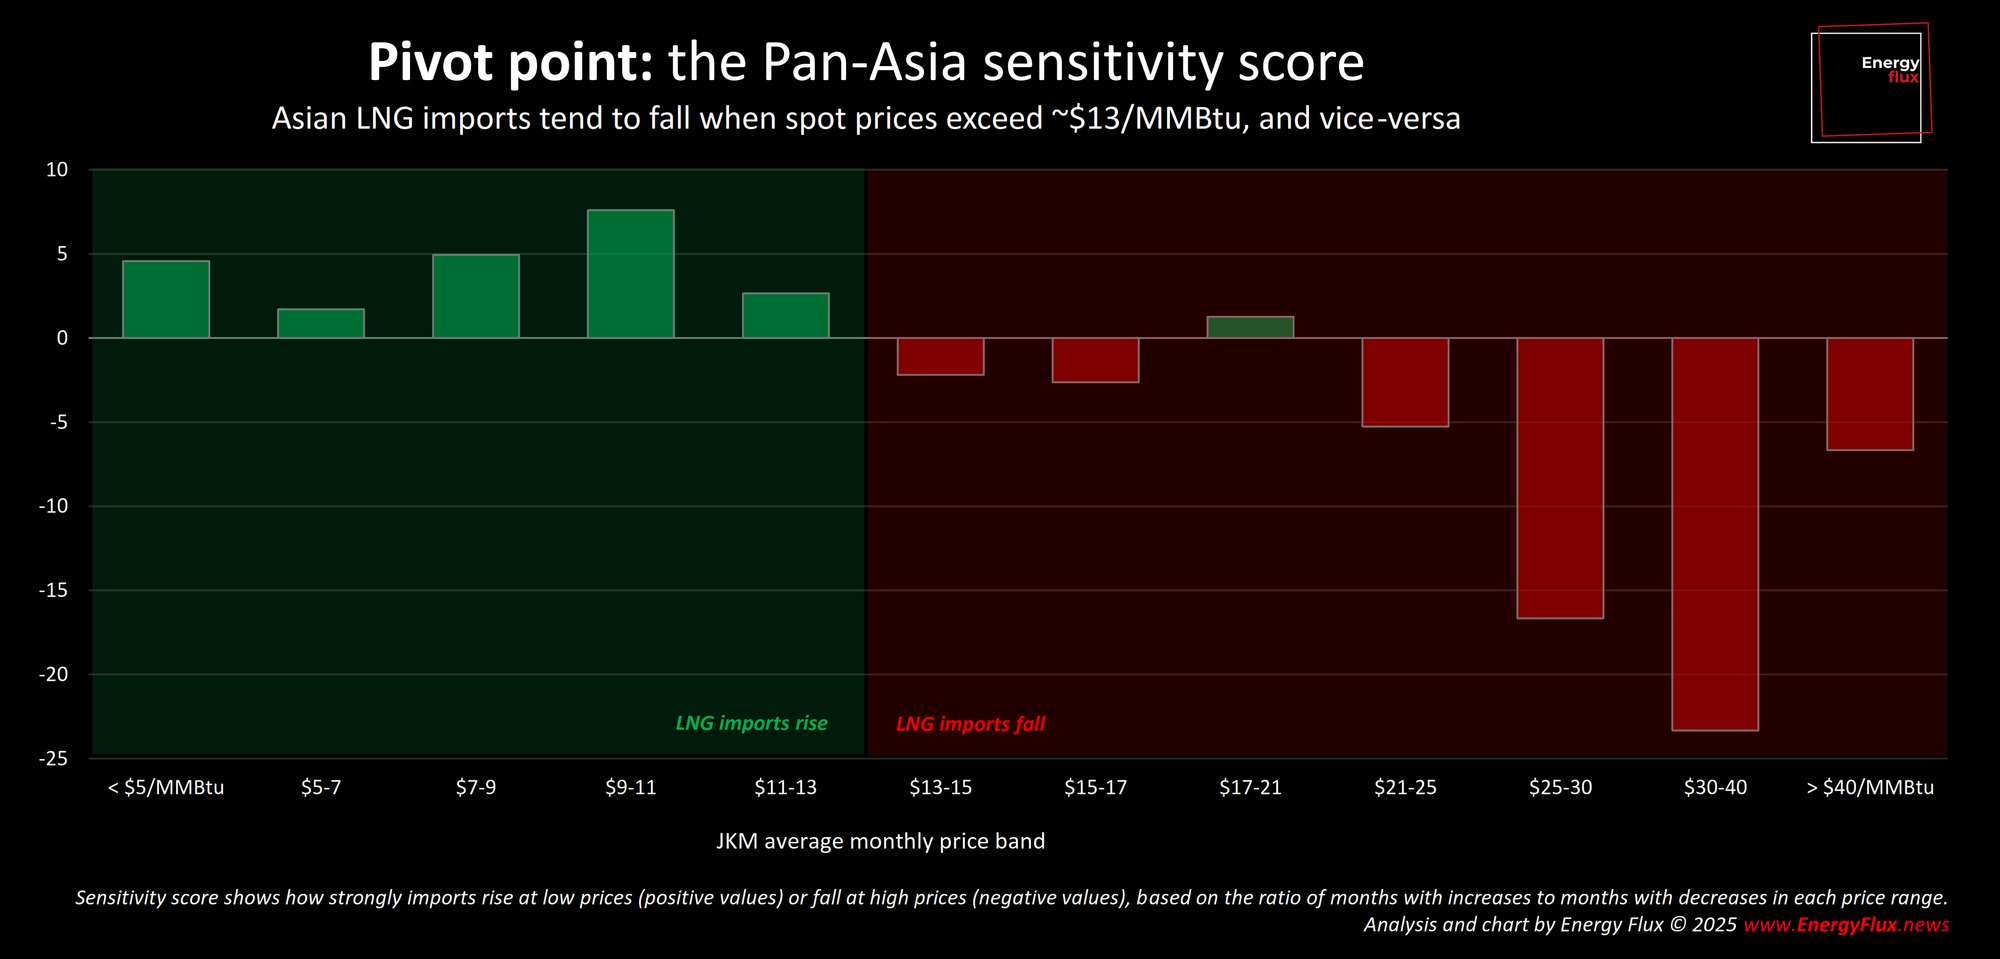
The top line is this: while lower prices do spark a response, the region’s appetite for a bargain has clear limits. Some countries jump at mid-range spot deals; others barely flinch, no matter how cheap the gas. The picture is far too nuanced to be captured in a single price point.
Members on the Premium and Deep Dive tiers are already reading this analysis. Join them: subscribe or upgrade now for full access.
This investigation offers deep commercial insight: fresh metrics and fresh knowledge, derived from rich historical data spanning from 2008 right up to the present day. In this post, readers will:
💡 Explore pan-Asian LNG demand price sensitivity and relative scores
💡 Compare country-by-country demand responsiveness at varying price bands
💡 See the heatmaps, histograms and price thresholds that reveal who blinks first when prices move
💡 Get the whole picture: full methodology, full transparency, and fresh insight into Asia’s LNG future
In the full piece: discover who’s most responsive, the markets where price no longer matters, and what these findings mean for the glut ahead. Unlock the full charts, country-by-country analysis, and commercial takeaways with a subscription.
💥 Article stats: 3,000 words, 20-min reading time, 13 charts & graphs

Member discussion: Pain threshold
Read what members are saying. Subscribe to join the conversation.