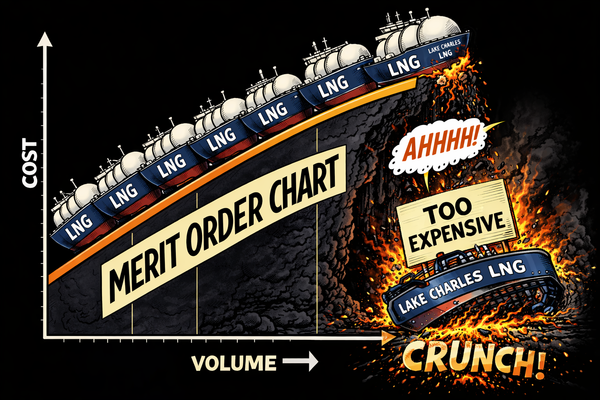
Chart Deck — 21 Nov 2025
New downloadable slide deck in PDF and PPSX formats, for convenient offline viewing

This is the new consolidated format for the Energy Flux Chart Deck.
Instead of publishing a hand-picked selection of charts each week, everything now sits in one place for a cleaner experience.
You get the full sequence laid out in order, allowing the data to speak for itself (50+ charts and graphs, minimal commentary).
It should make navigating the data quicker and give a more complete view of global gas and LNG dynamics.
Highlights:
- TTF Curve Slope looks remarkably bearish for this time of year (slide 8)
- TTF Sentiment Tracker settles into bearish quadrant (slide 13)
- Investment funds are within a sliver of net short TTF (slides 17-18)
- TTF Risk Model signals bullish risk under-priced (slides 26-29)
- Soaring freight rates are driving basinisation of flexible LNG (slide 33-34)
- US LNG is rapidly losing its competitive edge in Asia (slides 39-40)
- Global LNG market is physically oversupplied by 1.6 million tonnes (slide 51)

Member discussion: Chart Deck — 21 Nov 2025
Read what members are saying. Subscribe to join the conversation.


