Cold shoulder
Too much LNG, not enough comfort


With the winter drama now firmly in the rear-view mirror and the bearish shoulder season approaching fast, European gas markets are once again searching for a coherent narrative. The cold shocks are all but gone, the recent panic has faded, and the market is left to grapple with a familiar but uncomfortable question: what actually matters now?
This week’s Chart Deck breaks it all down in granular detail with the usual mix of exchange data, fund positioning, regional LNG physical flows, proprietary analysis of US LNG netbacks, arbitrage economics, and rolling assessment of the Asian spot market versus oil indexed LNG.
The Basis that bites both ways
The most under-discussed signal is the SparkNWE basis, which reflects the price of LNG in north-west European waters as a discount to Dutch TTF, the benchmark price for EU gas trade.
The assessment is a proxy for the value of LNG regasification capacity: in a benign market it trades in a narrow band, as LNG can find a home without running into infrastructure constraints. When it blows out, something is usually afoot.
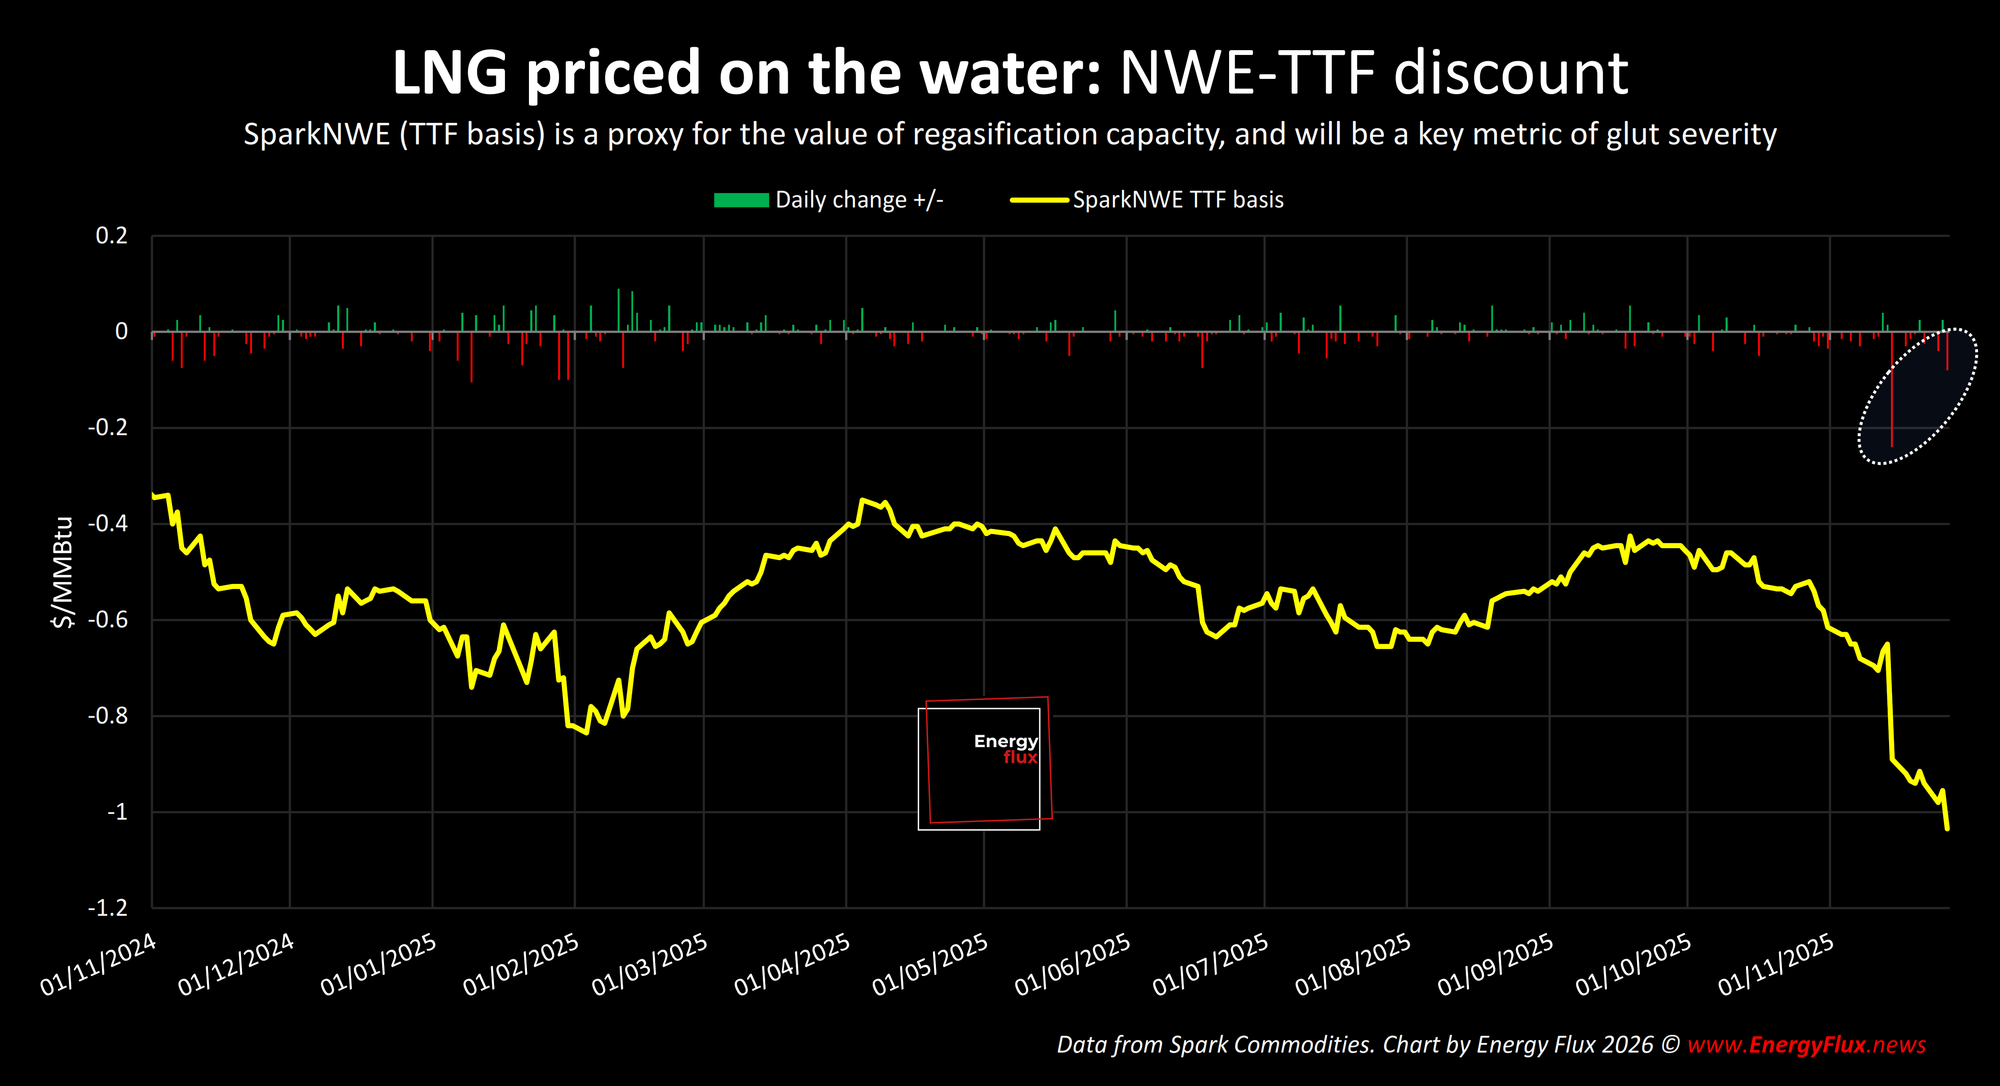
The SparkNWE basis has now widened beyond $1/MMBtu (slide 39), its highest point since October 2023. In today’s febrile betwixt-between market, this is contradictory.
On the one hand, it points to excess LNG sloshing around the Atlantic Basin, struggling to find a home. On the other, it implies rising scarcity value for north-west European regas capacity as the summer refill challenge comes into focus.
Both signals coexist uneasily, and the market has not yet decided which one deserves more weight. Perhaps the best read of it is this: too much LNG, running into pinch-points in a European gas system that has too much capacity in all the wrong places.

Storage: prudence or panic?
That ambiguity is reinforced by the state of EU gas inventories. Stocks are now scraping the barrel of historic norms (slide 44), uncomfortably low for this point in the calendar.
The key question is whether this reflects rational, proactive destocking in response to still-elevated prompt prices and the prospect of a flood of cheaper molecules, or something more structural.
If storage holders are simply seeking to crystalise extrinsic value ahead of refill season, the signal is benign. If, instead, inventories are low because there’s a genuine physical scarcity problem, the market may be underpricing the vulnerability this creates later in the year.
Either way, European refilling demand will keep a floor under summer hub prices, and this is reflected all along the 2026 forward curve (slide 10).
Widow-maker arbitrage
Shipping and global price signals add another layer of complexity. LNG freight rates remain depressed (slide 40), while the TTF premium over JKM has practically vanished (slide 11). Together, these dynamics are supporting the tentative reopening of the US LNG arbitrage to Asia (slides 62–64), with inter-basin flows from other Atlantic locations (such as Nigeria) looking marginally viable again (slide 41).
In theory, cheap LNG shipping rates and a tight EU-Asia spread should encourage cargoes to drift east. In practice, however, long-haul arbitrage remains fraught and a slew of extreme diversions executed at the height of the mid-January panic are now starting to look almost ridiculous (Australia to Europe, open for orders – any takers?).
Long delivery times and narrow pricing windows mean that many laden cargoes have been left zig-zagging across basins, chasing a moving target. The most profitable destination can shift multiple times mid-voyage, turning what looked like a clean arbitrage into a risk-strewn meander that stacks charter costs onto vanishing import prices (slides 67–73). The result is a struggle to monetise optionality, and a fickle market that punishes lack of conviction.
Sentiment, risk pricing and complacency
Against this backdrop, Energy Flux sentiment indicators are striking a nuanced tone. The TTF Sentiment Tracker has slipped back into bearish territory (slide 20), reflecting a market surprisingly complacent in light of recent price spikes.
At the same time, the TTF Risk Model remains conflicted between a softening TTF prompt premium and record-low storage levels (slides 33–36). Regardless of the motive, destocking materially increase exposure to shocks, yet prices and volatility are behaving as if the system is stable.
That tension may be the most important signal of all. With geopolitics unusually calm and risk premia compressed, the market is implicitly betting that nothing goes wrong. History suggests that is rarely a safe assumption. Low stocks do not matter until they suddenly matter a great deal, and when they do, repricing tends to be violent. Just cast your mind back by a few weeks.
For now, the gas market is drifting into shoulder season with a bearish tilt, but with latent fragilities hiding in plain sight. Keep an eye east, and keep an eye south. Iran, in particular, is conspicuous by its absence from pricing. As last week’s Deep Dive argued, the risk premium can resurface at a moment’s notice on the tiniest signal of escalation, because the potential for unintended outcomes is so large.
Volatility is noise. Nuance is signal. Get instant access to this week’s 80-slide Chart Deck and see what the positioning, flows and curves actually say — not what the market is shouting.
💥 DOWNLOAD: 80+ slides in .ppsx and .pdf format 👇

Member discussion: Cold shoulder
Read what members are saying. Subscribe to join the conversation.