Dwindling EU gas stocks amplify Hormuz risk premium
Without a deep winter buffer, the European gas market is vulnerable to exaggerated price moves

European gas markets are entering a period of heightened sensitivity, where geopolitical friction is intersecting with a fundamentally tighter near-term supply-demand balance than markets had anticipated at the end of last year. At the same time, market sentiment is steadfastly neutral in the face of competing directional pressures.
This week’s Chart Deck breaks it all down in granular detail with the usual mix of exchange data, fund positioning, regional LNG physical flows, proprietary analysis of US LNG netbacks, arbitrage economics, and rolling assessment of the Asian spot market versus oil indexed LNG.
Running on fumes
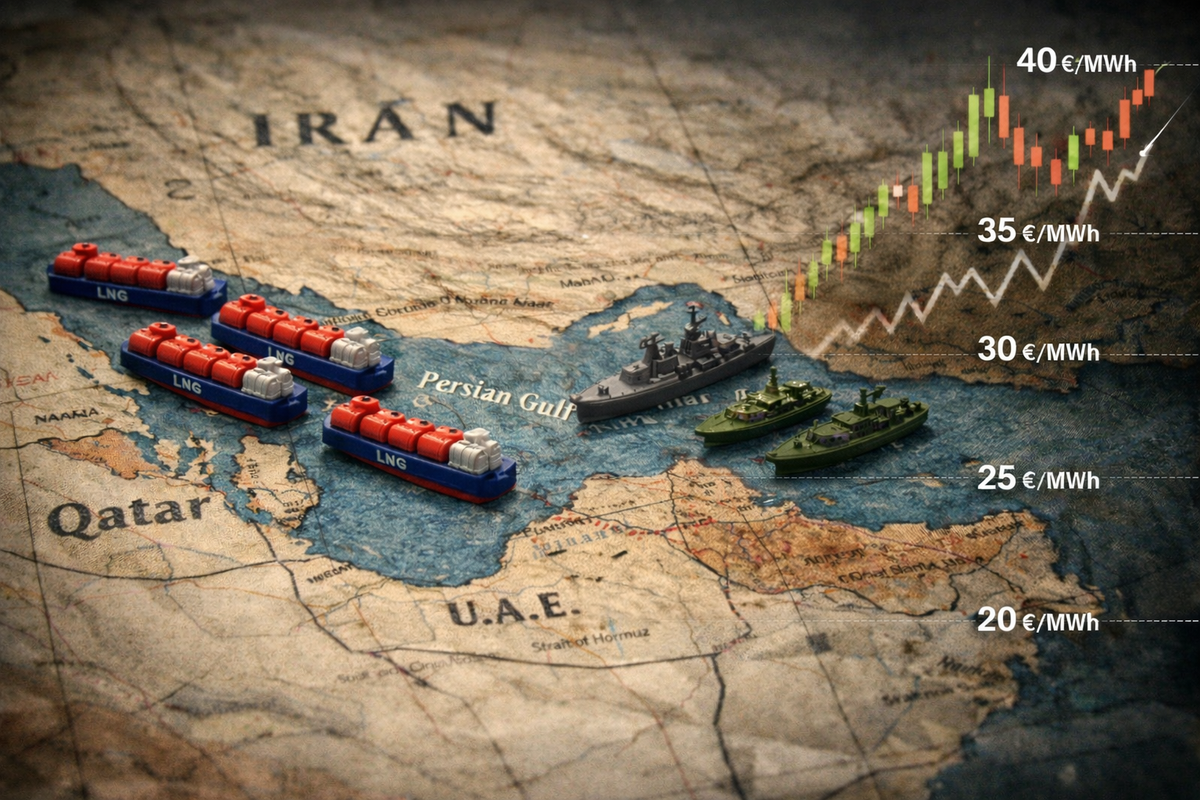
The geopolitical risk premium made a noisy return on Thursday, 19 February, when the front-month TTF contract (Mar-26) jumped by almost 10% (slide 9). The trigger was a repricing of potential disruptions to Qatari LNG exports passing through the Strait of Hormuz bottleneck, following further escalation in US-Iran tensions. While such a supply shock remains hypothetical (and frankly suicidal for the Islamic regime in Tehran), the market’s sharp reaction underscores how low inventories have left the European system with little margin for error.
This underlying fragility is rooted in the current state of European underground gas storage. Aggregate EU stocks have fallen below 32%, a level more than 14 percentage points lower than the long-run seasonal average. This is not merely a statistical outlier; it represents a tangible depletion of the buffer that historically insulated the market from late-winter cold snaps or supply disruptions (slides 42-44). Depletion leaves the market more sensitive to other supply risks, which explains the scale of the Hormuz premium repricing.
Storage tightness is a primary reason the TTF Risk Model maintains a marginally bullish bias, even as other indicators flash more neutral signals. Indeed, the market’s directional conviction appears to be in a state of flux. While the physical fundamentals are tightening, financial positioning tells a more complex story.
Funds flee TTF...?
In a notable divergence, hedge funds kept their net long positions virtually unchanged in the week preceding the Iran-induced price jump. More striking, however, is the sharp contraction in market participation: the number of funds actively trading TTF futures has dropped to 415, a significant retreat from the record high of 465 seen in January (slide 23).
This exodus of marginal capital raises a critical question: is this a temporary blip, with funds merely rotating out of positions before re-entering with renewed conviction, or does it signal a more profound shift in how speculative capital views the near-term risk-reward profile of European gas compared to other tradable commodities? For now, the TTF Sentiment Tracker captures this ambiguity, pegging sentiment as effectively neutral last week (slide 20).
LNG glut, where art thou?
Adding another layer of complexity is the contrasting performance of the LNG market. Europe continues to act as the global sponge for surplus supply, having absorbed 17% more LNG since the start of the year compared to the same period in 2025 (slide 75). This voracious appetite has been instrumental in absorbing burgeoning global supply growth, effectively masking what would otherwise be a more pronounced supply-demand mismatch (slide 72).
In parallel, the contours of the long-anticipated LNG supply ‘glut’ are evolving. The near-term wave of new supply keeps shifting to the right, even as the scale of the onslaught grows at the outer reaches of the decade. Qatar’s decision to delay the start-up of its North Field East megaproject has trimmed 9 Bcm (-15%) from the 2026 liquefaction build-out.
Simultaneously, the long-term horizon is expanding, with the restart of construction at the Mozambique LNG project adding 17.5 Bcm to the 2030 capacity outlook (slides 88-89). The narrative is therefore shifting: rather than an abrupt, overwhelming surge in supply, the market now faces a less aggressive near-term ramp-up, but one that promises a longer, more sustained period of excess capacity well into the next decade — if it ever actually shows up, that is.
Volatility is noise. Nuance is signal. Get instant access to this week’s 80-slide Chart Deck and see what the positioning, flows and curves actually say — not what the market is shouting.
💥 DOWNLOAD: 80+ slides in .ppsx and .pdf format 👇

Member discussion: Dwindling EU gas stocks amplify Hormuz risk premium
Read what members are saying. Subscribe to join the conversation.