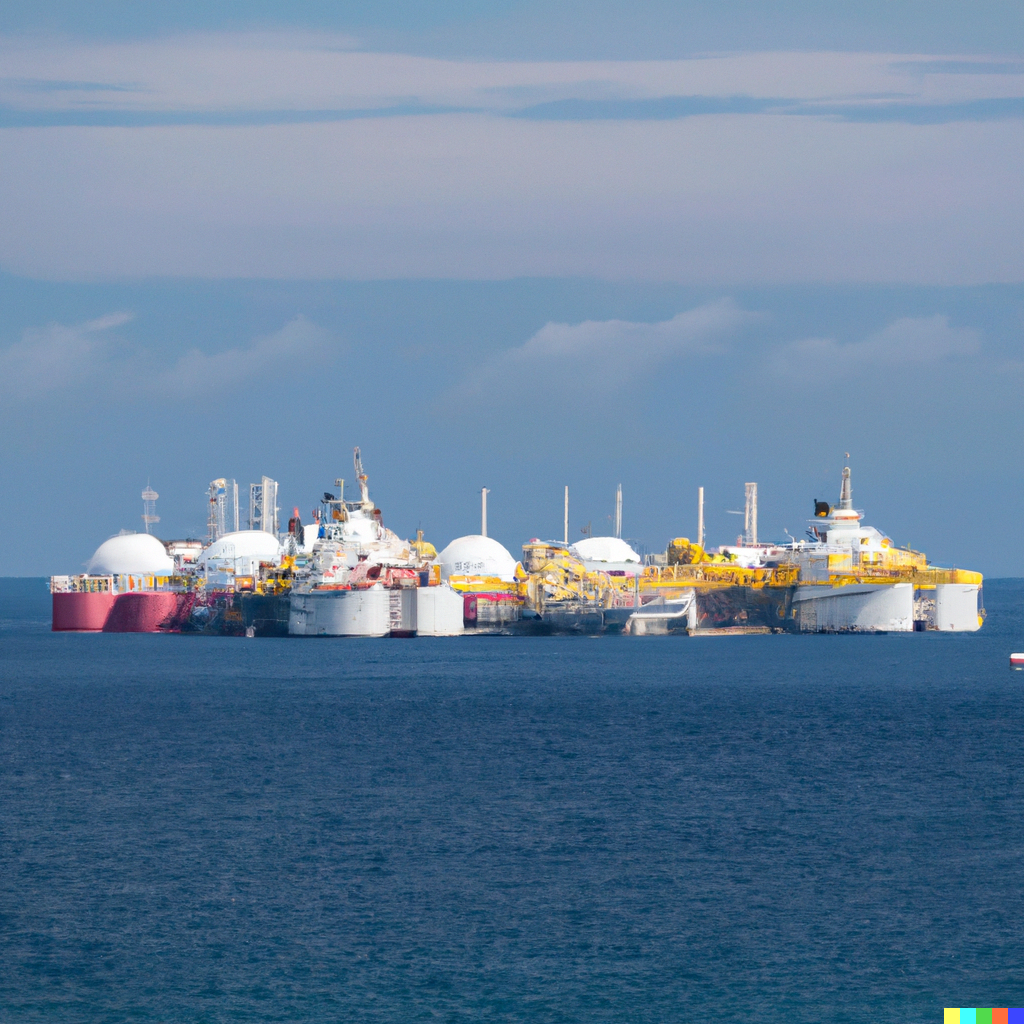

Discover more from Energy Flux
Gas on the water
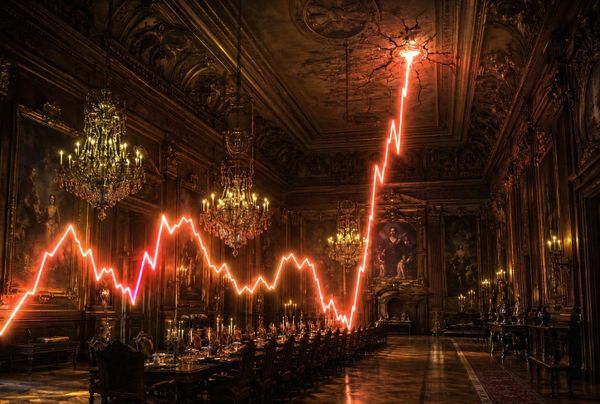
Bizarrely, natural gas is now worth more at sea as LNG than in underground storage. EU LNG chart deck: 14-18 Aug 2023
Europe is simultaneously awash with gas and facing a likely need to import more LNG soon — and markets are moving in odd ways to reflect this paradox.
EU gas stocks are at record highs and likely to hit maximum technical capacity as soon as late September. But even when full, EU has storage is sufficient to cover only about one-third of Europe’s winter gas demand (depending on weather), so futures markets are trying to price in both the current glut and the need to attract more LNG over the winter.
The narrative that ‘Europe still needs more LNG’ appears to be winning out. Contrary to expectations, Dutch TTF (the European gas benchmark) last week extended recent gains amid ongoing fears of global supply disruption being caused by strike action at Australian LNG plants.
This trend cannot continue. While some traders are now hoarding gas in Ukraine’s vast and under-utilised underground storage facilities, the fact that EU stocks are approaching tank-tops means TTF will need to retreat. This must happen to deter further LNG imports and spur gas consumption in in industry and power generation.
This explains why the greatest gains on TTF last week occurred further out on the curve between November and January, with the September contract closing down 2% on the week and October registering only a modest weekly gain. (The front month expiry and rollover from September to October on Friday makes the weekly table at the top of this post a bit misleading because the latter contract always trades at a premium to the former.)
More significantly, Friday saw an anomalous spike in CME’s North-West Europe LNG futures. September-dated NWE LNG leapt 20% in the session to settle at almost $16/MMBtu, putting it at a premium to both TTF and JKM (the Asian LNG benchmark, which also closed the week up 25%). The same movement was echoed along the NWE LNG forward strip.
Why? This one is tricky to explain. With traders holding more LNG on the water in anticipation of a mid-winter spike, the NWE LNG price should be coming under pressure — not rallying like this.
Here’s my best guess (and if you have a better explanation, please share it in the comments section): with gas stocks brimming, Europe is outsourcing its storage needs to the LNG freight market by using vessels as floating storage. This is placing a premium on both gas held on the water and the vessels themselves.
The freight rally flagged in last week’s edition is starting to play out. Fearnley’s spot LNG vessel charter rate rose from $72,500 to $100,000 per day on Thursday, pushing up the cost of shipping LNG to Asia. This will ultimately draw more cargoes into floating storage in North-West European waters, even if there is physically nowhere to unload them within the EU gas system.
The best way to visualise this dynamic is in the NWE-TTF spread, which is now inverted from October to December. This spread, as explained last week, is a proxy for the value of EU regasification and gas storage capacity. TTF trades at a premium when European restocking demand is stronger than the ability to meet that demand.
The spread inversion is a function of restocking demand falling away in response to lack of physical storage capacity and weak industrial activity. NWE LNG trading above TTF places a theoretical price incentive for Europe to export gas as LNG and keep it there on the water until gas stocks start to deplete and TTF rises to draw it back in.
Exports are impossible, of course, because Europe has practically zero liquefaction export capacity (and the cost of liquefaction and freight would erase any gains). But visualising it this way helps to understand how markets are contorting in the face of competing narratives.
Odd things are also happening to US LNG netbacks. Europe is still offering better profits than Asia for spot LNG leaving the US Gulf Coast due to higher freight rates (even though JKM’s 25% rally last week restored the ‘Asian premium’). But on a pure netback basis, the biggest margin would be secured by anchoring that same cargo in the Bay of Biscay and trading it at the going NWE LNG rate.
Such a trade is unlikely to happen in the real world because most if not all US LNG spot cargoes entering Europe change ownership at the LNG import terminal, not at sea (whereas Asia-bound cargoes traded on JKM often do change hands at sea). But stranger things have happened, and a buildup of LNG vessels in European waters would be motivated by the strange pricing we are currently seeing.
The Energy Flux EU LNG chart series is a work in progress. Let me know if this analysis is valuable, or how it can be improved, by leaving a comment.