
Chart Deck
The Ukraine-sized hole in ENTSOG’s winter outlook
Modelling by Europe’s gas network operators implies Ukraine would send almost 5 Bcm westward in a harsh winter, even if that means leaving one tenth of domestic demand unmet
A weekly visual briefing on gas and LNG market dynamics, published every week in PDF and PPSX formats. The Chart Deck is home to the TTF Risk Model, TTF Sentiment Tracker, Storage-Speculation Nexus regression model and other proprietary analysis of benchmark pricing, arbitrage economics, speculative capital flows and physical trade flows. Available exclusively to subscribers on the Chart Deck and Premium subscription tiers. Latest issues below 👇

Chart Deck
Modelling by Europe’s gas network operators implies Ukraine would send almost 5 Bcm westward in a harsh winter, even if that means leaving one tenth of domestic demand unmet

Chart Deck
Investment funds spent six weeks selling hard into a rally that lifted TTF to €80/MWh. The supply risk is real, and ENTSOG’s winter outlook quietly agrees
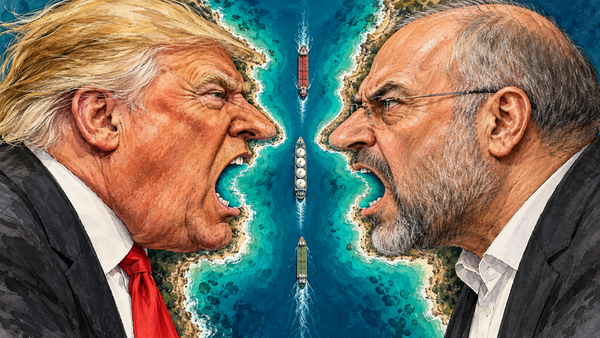
Chart Deck
Washington says Iran has lost control of Hormuz. Iran says it struck tankers on its blacklist. More ships are moving, but on whose terms?

Chart Deck
TTF has swallowed more of the Hormuz closure risk. Beneath the latest peace sell-off, funds have banked profits and made room to buy again.

Chart Deck
Hedge funds cash in as winter scarcity fears ignite EU gas market
Chart Deck
European gas is trading in the fleeting umbra of an eerie calm. Eclipses always end — and this one ends in a searing winter burn

Chart Deck
Attempts to break the US-Iran stalemate are raising the risk of conflict sprawling sideways into dimensions the market has not yet priced
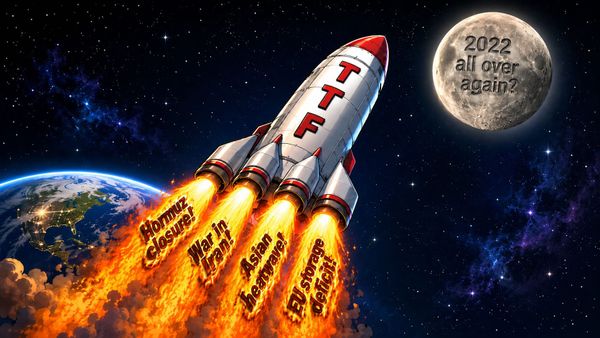
Chart Deck
EU gas price surges past €60 per MWh. But is the top already in?
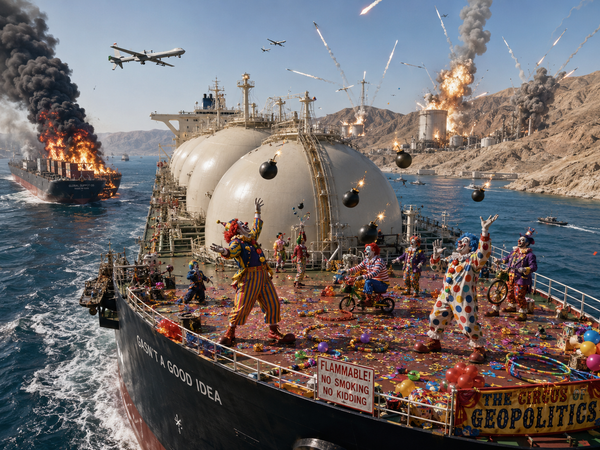
Chart Deck
Diplomacy has taken the back seat in the clown car. Markets have stopped laughing and started buying
Chart Deck
“After four months of paralysis, the relief is palpable. It may also be misleading. And it is almost certainly temporary.” – Energy Flux, 26 June 2026 Well, that didn’t last long. Barely three weeks into a supposed two-month ceasefire, US missiles and Iranian drones are criss-crossing the Persian

Chart Deck
Iran holds the valve, but it is worth less every time it turns... so Tehran is reaching for the gun.

Chart Deck
Markets have priced the US–Iran ceasefire as a fully-fledged peace deal. The 60-day clock, and our models, suggest otherwise.