The Panama paradox
Canal drought leaves US LNG exporters facing tricky choices | EU LNG Chart Deck: 5-16 Feb 2024

An unprecedented drought on the Panama Canal is forcing American liquefied natural gas exporters to take a much longer route to Asia. Modelling by Energy Flux reveals that the profitability of US LNG cargoes drops by 20% or more once the extra cost of shipping via southernmost Africa is factored in — erasing gains from delivering the fuel to ‘premium’ Asian markets. US exporters must either swallow higher Asia shipping costs, or send volumes to Europe — where brimming storage and sluggish demand recovery is depressing hub prices.
Being a seaborne fuel, LNG is exposed to transit risks on oceanic trade pinch-points. The Panama Canal Authority last year almost halved traffic on the waterway to preserve water in depleted reservoirs used to fill the canal’s enormous lock pounds. The authority recently confirmed restrictions will remain until the (anticipated) start of the rainy season in April. Until then, only 24 transits are permitted per day compared to the usual 38-40 — and full ‘normalisation’ might not return until 2025.
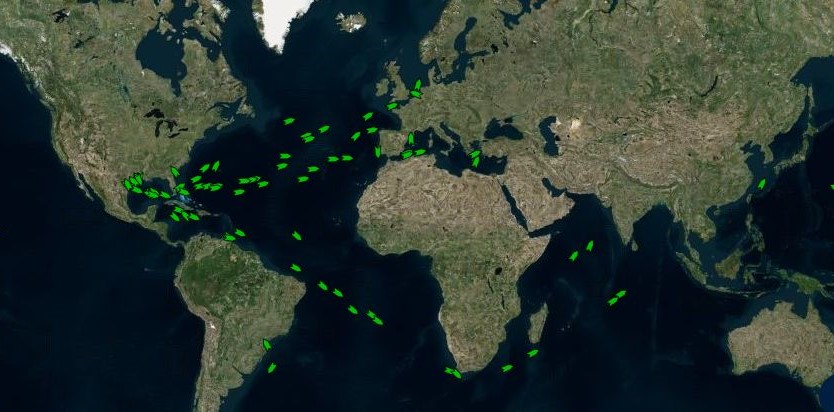
Cryogenically frozen LNG boils off in transit, so waiting weeks for a canal slot implies an unacceptable loss of cargo. Moreover, the profitability of uncontracted LNG is diminishing as spot markets soften amid persistently weak near-term fundamentals.
With European gas hubs virtually in freefall, Asia now offers a significant premium for uncontracted ‘spot’ LNG. But the Panama restrictions and cost of shipping via southern Africa make these markets much harder to reach.
The dent on profits is large enough to erase the ‘Asian premium’ between August and December this year. The upshot is that European importers might find they are inundated with US LNG cargoes that would otherwise go to China, Japan or South Korea, allowing them to stock up cheaply in time for next winter. This would help offset any lost or delayed supplies of Middle Eastern LNG in Europe arising from the de-facto closure of the Suez Canal due to Red Sea insecurity, as explored in the last week’s Deep Dive.
With the aid of several new charts and graphs, this EU LNG Chart Deck analyses US LNG netbacks (profits) in Asia over the next 12 months via Africa versus the conventional Panama route, and compares these to the profitability of selling into north-west Europe. The findings are striking.
This week’s post also peers further ahead to 2026-27. Markets are now pricing in a convergence in US LNG delivered costs and European hub prices at this time, when the coming LNG glut will be in full effect. This reality casts in a new light Shell’s latest LNG Outlook — which few observers realise actually paints a more bearish picture of LNG demand growth out to 2040 than any oil major had publicly acknowledged until now.
Ready? Vámonos!
Article stats: 2270 words, 11-min reading time, 7 original Energy Flux charts/graphs

Member discussion: The Panama paradox
Read what members are saying. Subscribe to join the conversation.
