The boy who cried ‘bull’!
CHART DECK: Will anyone believe stern warnings of market tightness ever again?


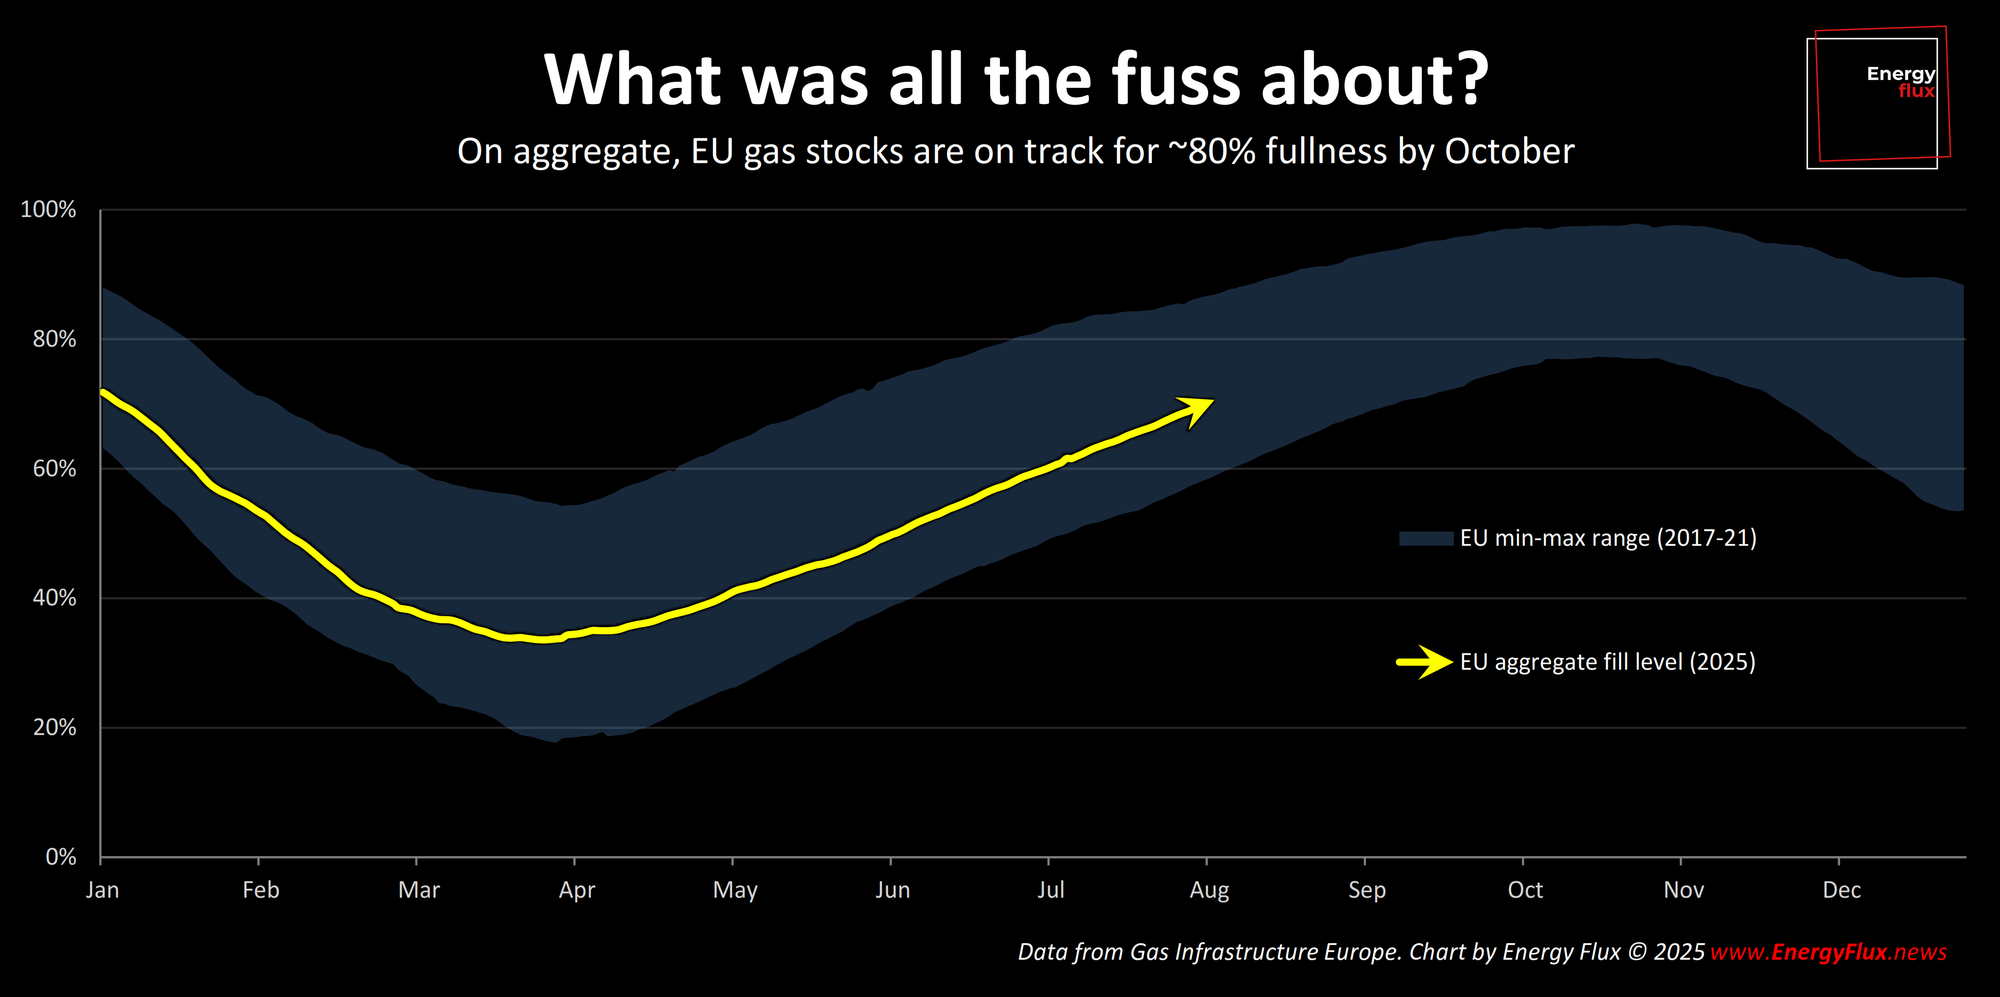
The European gas market has come a long way since the start of the year, when pundits were hyperventilating over the ‘dangerously low’ level of gas held in underground storage.
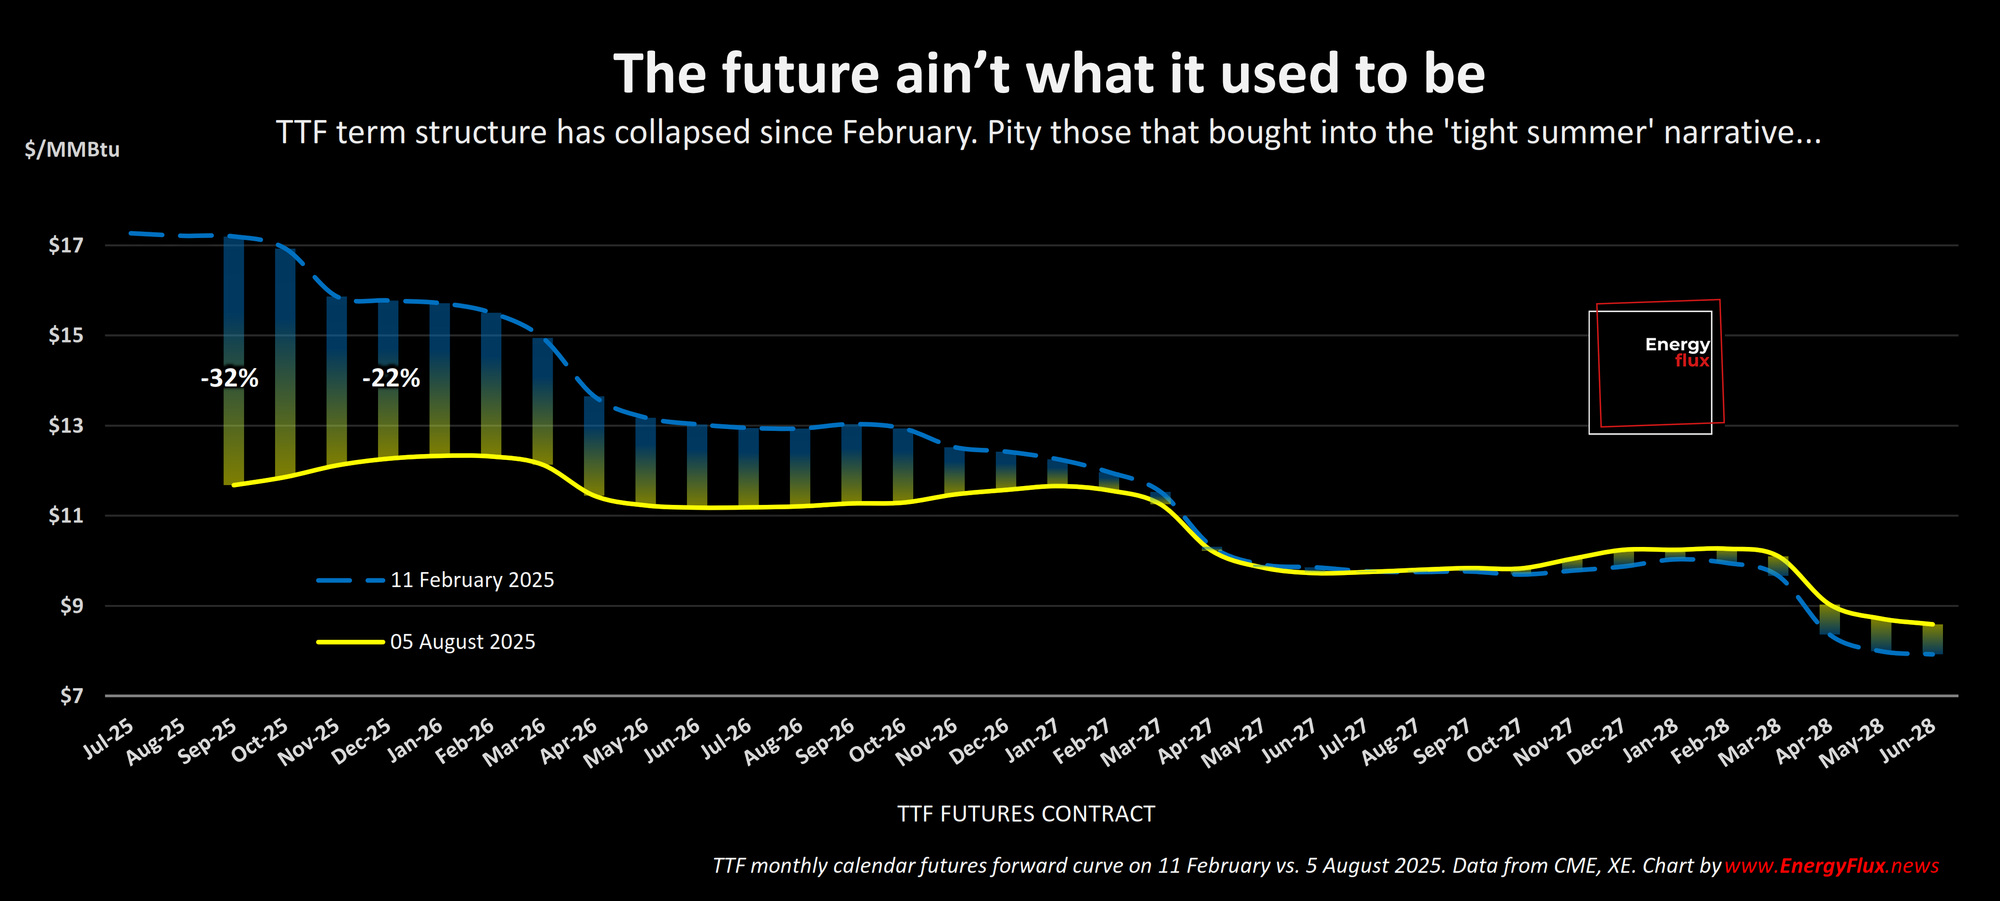
Fast-forward a few months, and the winter warnings of a ‘tight summer refilling season’ have melted away like ice cream in a heatwave.
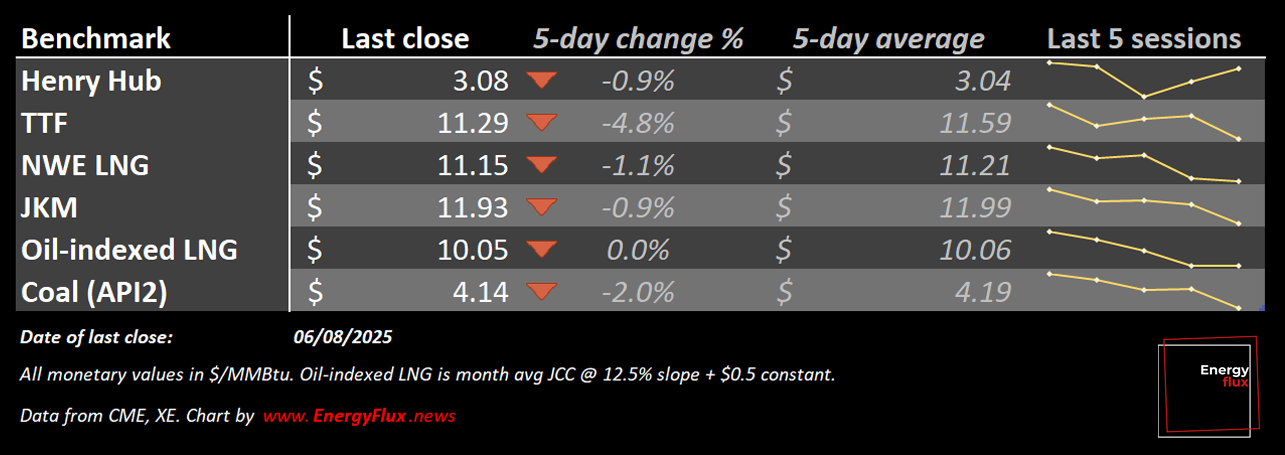
Where exactly are gas markets at? The sleepy summer months offer an opportunity to take stock of slow-burn indicators.
On aggregate, European storages are filling up at a steady clip and are on track to easily surpass the bloc’s newly adopted gas storage target of 83% by the 1st October to 1st December window.
The phase shift in sentiment and price outlook since late winter has been remarkable. The Sep-25 TTF contract – currently the front month – has fallen by one-third since February. Jan-26 TTF is down by a fifth.
Spare a thought for European industrial consumers and non-vertically integrated utilities that must procure gas on the open market.
Bombarded by scary messaging about delayed LNG start-ups and the challenge of refilling to 80% without Ukraine gas transits, there must have been a strong temptation to hedge some 2025 consumption before the first wave of correction in February.
Doing so, and then watching the market implode, would have been a bitter pill to swallow.
Once bitten, twice shy
Would any procurement officer or risk manager wearing the scars of the 2025 correction believe prophecies of doom ever again? False harbingers eventually lose all credibility.
But what if, like the boy who cried wolf, the worst case scenario transpires after all faith in the shepherd is lost?
The coming winter might test exactly this scenario. While market conditions appear benign, the Energy Flux TTF Risk Model paints a more nuanced picture. And there remains the ever-present risk of geopolitical melt-ups and supply-side calamity.
This week’s subscriber-only Chart Deck looks beyond the lackadaisical pulse of sun-drenched summer energy markets to identify where latent risks are being mis-priced.
With the help of the TTF Sentiment Tracker and TTF Risk Model, this post takes a scalpel to the ICE Endex Commitment of Traders data. It also includes:
- Oil indexation vs. spot LNG comparative price analysis
- Asia-Europe arbitrage for LNG from global FOB locations
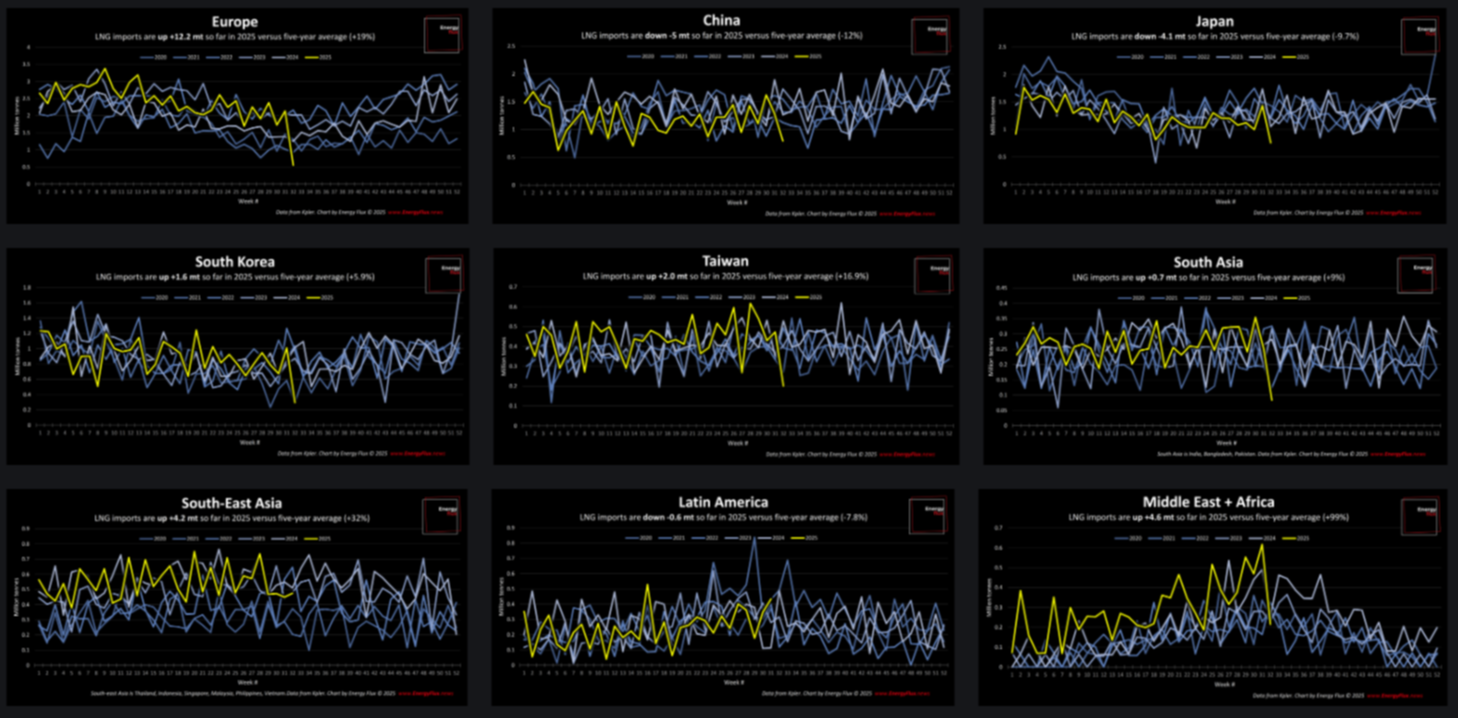
- A special interactive gallery of regional LNG imports:
Level up your energy market insight. Get instant access with a 7-day free trial of Energy Flux 👇
💥Article stats: 1,100 words, 8-min reading time, 20 charts and graphs

Member discussion: The boy who cried ‘bull’!
Read what members are saying. Subscribe to join the conversation.