
The cost of volatility
Who pays when risk management itself becomes riskier and more expensive?

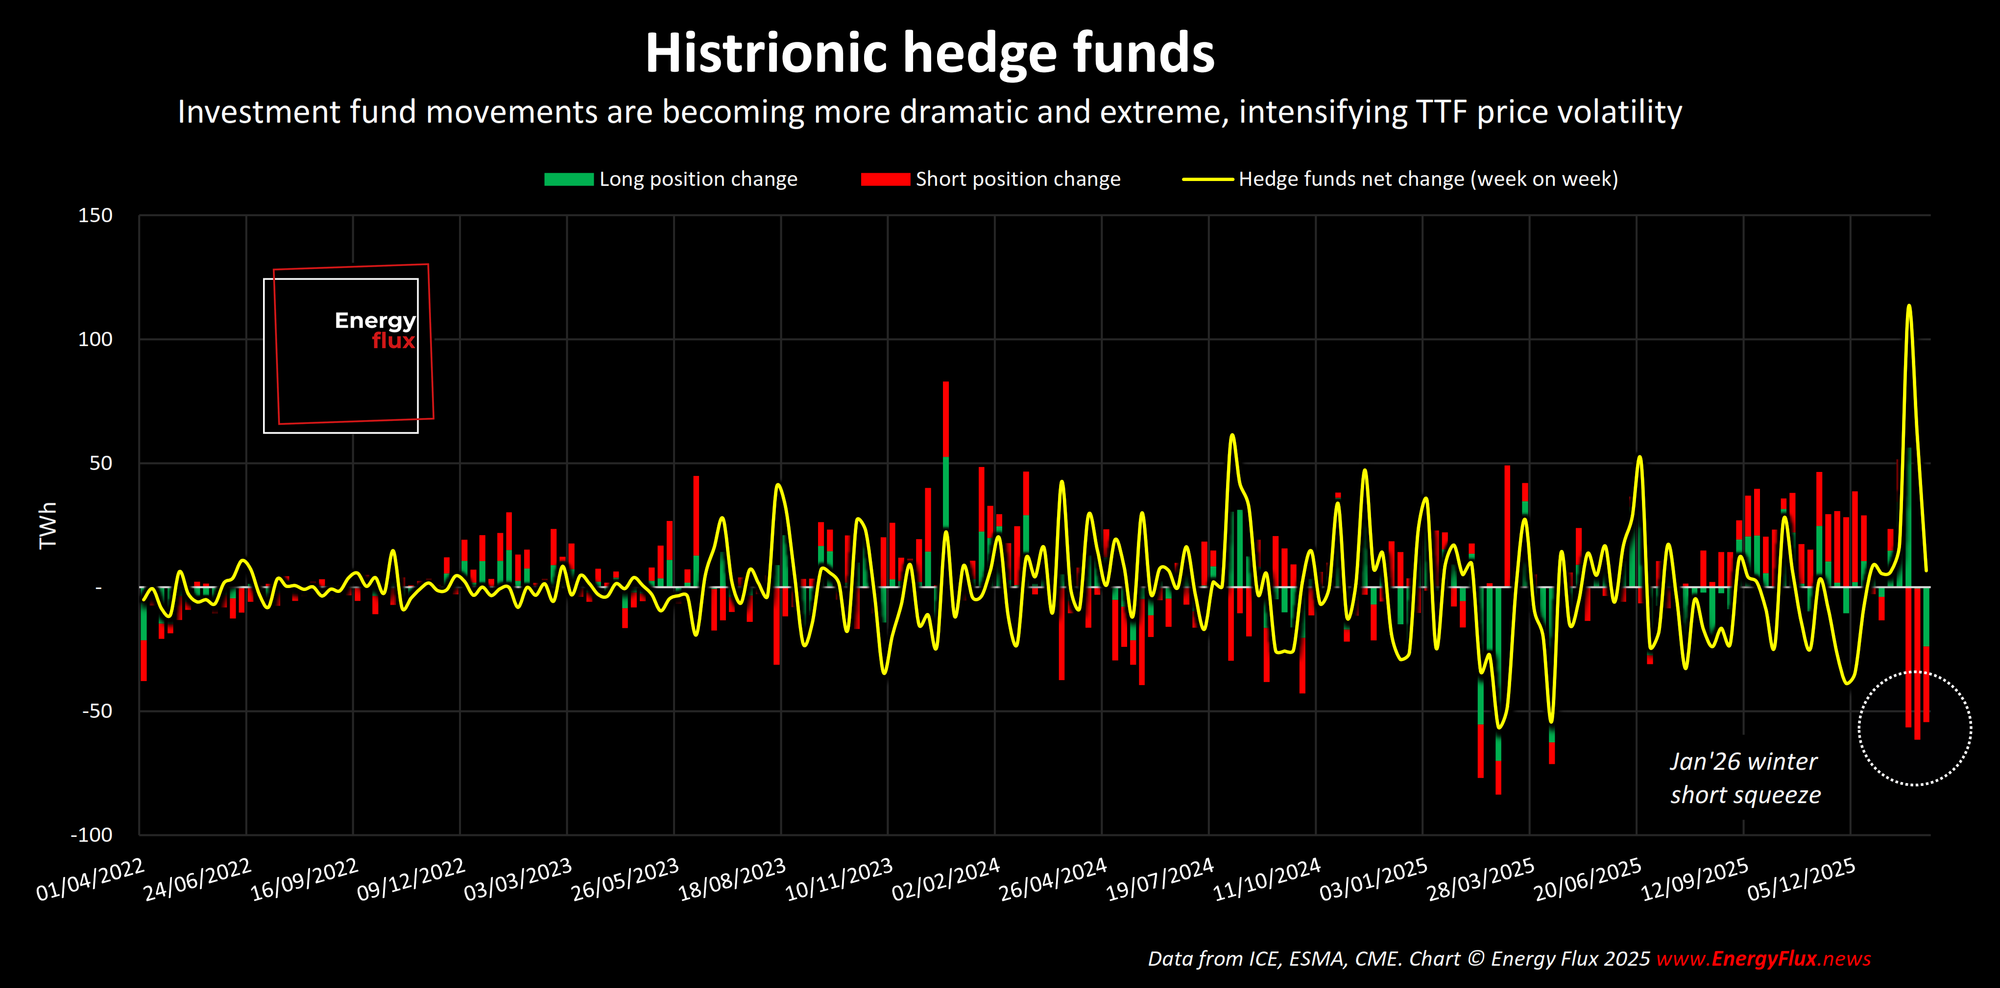
The superficiality of the recent winter price rally on EU and US natural gas trading hubs has become clear in the way that investment funds have repositioned since the rally.
Hedge funds did not add much length during the price spike, and last week they even sold down some TTF long positions as prices returned to earth. Evidently, funds see only limited upside as the market shifts from late winter and into early spring.
This is further evidence that the January spike was an opportunistic weather-driven short squeeze and equally violent reversion, not a shift back into a bullish pricing regime.
The predilection of global natural gas trading hubs to over-react to fast-changing fundamentals is nothing new. But the scale of that over-reaction is pushing the envelope on volatility, complicating even the most robust risk management strategies.
When bidirectional double-digit price swings can clatter through both long and short stops in a matter of days, hedging costs and collateral requirements rise for all market participants.

Trading costs on the rise
Intercontinental Exchange this week hiked margin rates by almost 50% for the front-month TTF contract (March '26), with smaller increases applied for contracts further out on the curve.
ICE sets margin rates for TTF futures primarily to protect the clearinghouse and market participants from default risk in a highly volatile market. These rates are dynamically adjusted based on real-time market conditions, and should be reduced as things calm down a bit.
Still, the requirement to carry much larger amounts of capital in case weather-driven sentiment turns against a trader’s position eats into margins and drives up the cost of managing risk in the derivatives market.
For funds and speculators, this ties up capital, increases financing costs, and directly reduces potential returns. A sudden large increase can force traders to liquidate positions to meet calls, impacting their profitability and trading strategy.
For physical players hedging their exposure in derivatives, higher margins make it more expensive to maintain positions. Part of this elevated risk management cost can be factored into their long-term pricing, which is ultimately passed onto consumers in the form of higher retail tariffs.
The link is not immediate or direct, but it is real.
Haunted by the 2022 crisis
In 2022, at the height of the energy crisis when TTF prices went stratospheric, margin rates underwent successive rapid increases. In fact, “between the low[ prices] of 2018 and the highs of 2022, there was a 60-fold difference in margin levels,” according to FIA, a trade body representing the commodity futures industry.
“Businesses were forced to make decisions between closing out hedges to reduce margin or resorting to high-cost borrowing to meet the calls. Some firms were brought to the brink of collapse by the rapid increase in margin levels required to cover potential future losses,” FIA said in a 2024 blog post.
We are a very long way away from the insanity of 2022. But the aftershocks of those events still reverberate through the market at times of heightened uncertainty. One outlandish weather model run, and fear can spread like contagion.
If managing physical risk in the derivatives market becomes an expensive and risky endeavour in itself, then more trades could shift off the major exchanges and move elsewhere.
For example, commercial operators could seek bilateral trades in over-the-counter (OTC) markets, where there is less transparency more counterparty risk than on ICE, EEX or CME.
Ultimately, when hedging on-exchange becomes prohibitively expensive, the market’s search for alternatives may trade one set of risks for another: one that is less visible and less quantifiable.
Mass migration off exchanges and into OTC markets would be an extreme outlier scenario. But if recent events prove anything, it is that unthinkable outcomes can transpire at short notice.
Chart Deck: the risks of returning to normality
This week’s subscriber-only Chart Deck is a far less dramatic affair than recent editions. But in today’s gas markets, tranquillity does not equate to plain sailing.
HIGHLIGHTS
- The TTF Sentiment Tracker’s bullish signal has retreated from prior week extremes as hedge funds curbed their rate of short selling and starting selling off long positions too (slide 20).
- At the same time, the TTF Risk Model swung back to moderately bullish-underpriced territory (slides 33-36) driven by moderation in TTF curve slope backwardation (slide 12) and an incipient recovery in seasonal calendar spreads (slide 13).
- With natural gas hub prices coming swiftly back down to earth, LNG trade economics are being subjected to competing push-pull incentives.
- As Dutch TTF returns to pre-spike norms (slide 9), the North-West Europe LNG price collapsed even faster, widening the SparkNWE basis to almost $1/MMBtu, its lowest point since Oct’23 (slide 39).
- This puts EU LNG imports firmly in the money, paving the way for an acceleration of European LNG imports to offset rapid storage withdrawals and meet residual winter demand.
- However, collapsing freight rates (slide 40) are narrowing LNG netbacks from global FOB locations, raising the prospect of inter-basin arbitrage reopening (slide 41).
- Low freight rates and a narrowing TTF premium over JKM (slide 10) are driving futures markets to price in a potential reopening in the US LNG arb to Asia (slides 62-64).
- Considering the size of the refill task facing Europe (slides 42-44), the risk of cargo flow out of the Atlantic Basin will keep a floor under TTF and NWE LNG prices.
- If Asian demand returns, this will translate directly into higher hub prices in Europe. But for now, supply growth continues to exceed demand recovery (slide 71).
💥DOWNLOAD: 70+ slides in .ppsx and .pdf format 👇
Volatility is loud. Signal is scarce. Get instant access to this week’s 80-slide Chart Deck and see what the positioning, flows and curves actually say — not what the market is shouting.

Member discussion: The cost of volatility
Read what members are saying. Subscribe to join the conversation.