TTF Risk Model v2.0
New and improved modelling cuts through the noise to give a clearer view of shifts in risk pricing

Over the past few weeks, I’ve been refining a methodology to quantify how risk is being priced into European gas markets. The new TTF Risk Model has evolved substantially, and will be incorporated into future editions of the Chart Deck.
This post explains the advancements and how to read the new scoring system. At the end, it unveils the first model V2.0 run and what the output tells us about the current market structure and risk pricing at the dawn of an unprecedented global LNG glut.
The original version of the TTF Risk Model tracked the relationship between weekly changes in European gas prices and a custom-built ‘risk score’ derived from futures curve structure and trader positioning data.
That version picked up some useful signals, but it was noisy and prone to overreacting to short-term market moves (as detailed previously, see here and here).
The updated version takes a more stable and structured approach. The TTF price data is now smoothed using a 12-week moving average to strip out a lot of the market’s week-to-week volatility.
This helps to surface broader shifts in price regime — the kind of movement that’s more likely to matter to physical buyers, risk managers, and longer-horizon traders.
How the score works
To recap, the risk score is built from four components (each of which is weighted to optimise for maximum correlation with TTF price movements):
- Curve Slope: This measures the shape of the TTF forward curve — whether it’s upward sloping (contango) or downward sloping (backwardation). A steeper backwardated curve suggests tight near-term supply and strong pricing risk. This input is weighted positively (+0.6), meaning it pushes the score higher when the market structure is tight.
- Investment Fund positioning (IF): This captures how heavily hedge funds are positioned in the market relative to historic norms. When funds are strongly net long, the model reads that as a potential sign of complacency towards correction, and gives it a heavy negative weight (–0.9). In other words, crowded long positioning is seen as increasing downside risk.
- Commercial hedging (CU_RR): This looks at the risk-reducing activity of commercial players, such as producers and large end users. When these actors are actively hedging more than usual, it signals they are nervous about future price moves. The model gives this a negative weight (–0.6), again treating it as a warning sign.
- Commercial speculation (CU_spec): This captures more speculative positioning by commercial traders, typically proprietary desks or trade houses taking directional bets. A negative weight (–0.3) means that when this activity rises above normal, the model interprets it as a signal of increasing market confidence or risk appetite — which can coincide with underpriced downside risk.
Together, these four ingredients form a composite score that reflects how the market is collectively pricing, hedging, and reacting to perceived risk:
Risk Score = Curve Slope + IF + CU_RR + CU_spec
How to read the results
When we compare this risk score against the 12-week moving average of weekly TTF price changes, the correlation is strong — with an R-squared value of 0.51. That means the model explains more than half (51%) of the variation in smoothed weekly price changes.
What’s important here isn’t just the statistics, but the signal: this model appears to reflect real shifts in market behaviour. When the score rises, it typically signals a tightening market with relatively little complacency — a regime that tends to support prices.
When the score falls into negative territory, it tends to reflect risk-on sentiment getting overextended, positioning crowding to one side, or commercial actors trying to get ahead of expected weakness. In these moments, the market may be under-pricing downside risk.
The aim isn’t to build a crystal ball; rather, it’s to give market participants a clearer sense of where risk is hiding in the price. By combining curve shape and trader behaviour into a single, interpretable metric, the model helps cut through the noise. It offers a directional indicator of risk pricing — not in the sense of forecasting day-to-day moves, but in identifying when sentiment, positioning and structure are aligning (or diverging) in ways that matter.
More work is underway to validate its predictive performance and explore how it behaves under different market regimes. But even in its current form, this new version of the TTF Risk Model is a practical tool for making sense of complex market dynamics, and for spotting when things may not be as stable as they seem.
Hedge funds vs. the Model: a signal within the signal
There’s an interesting wrinkle in the data worth highlighting. When we compare the full TTF Risk Model Score against actual TTF price changes, we get a solid correlation: R² = 0.51 when using 12-week moving average with no lag.
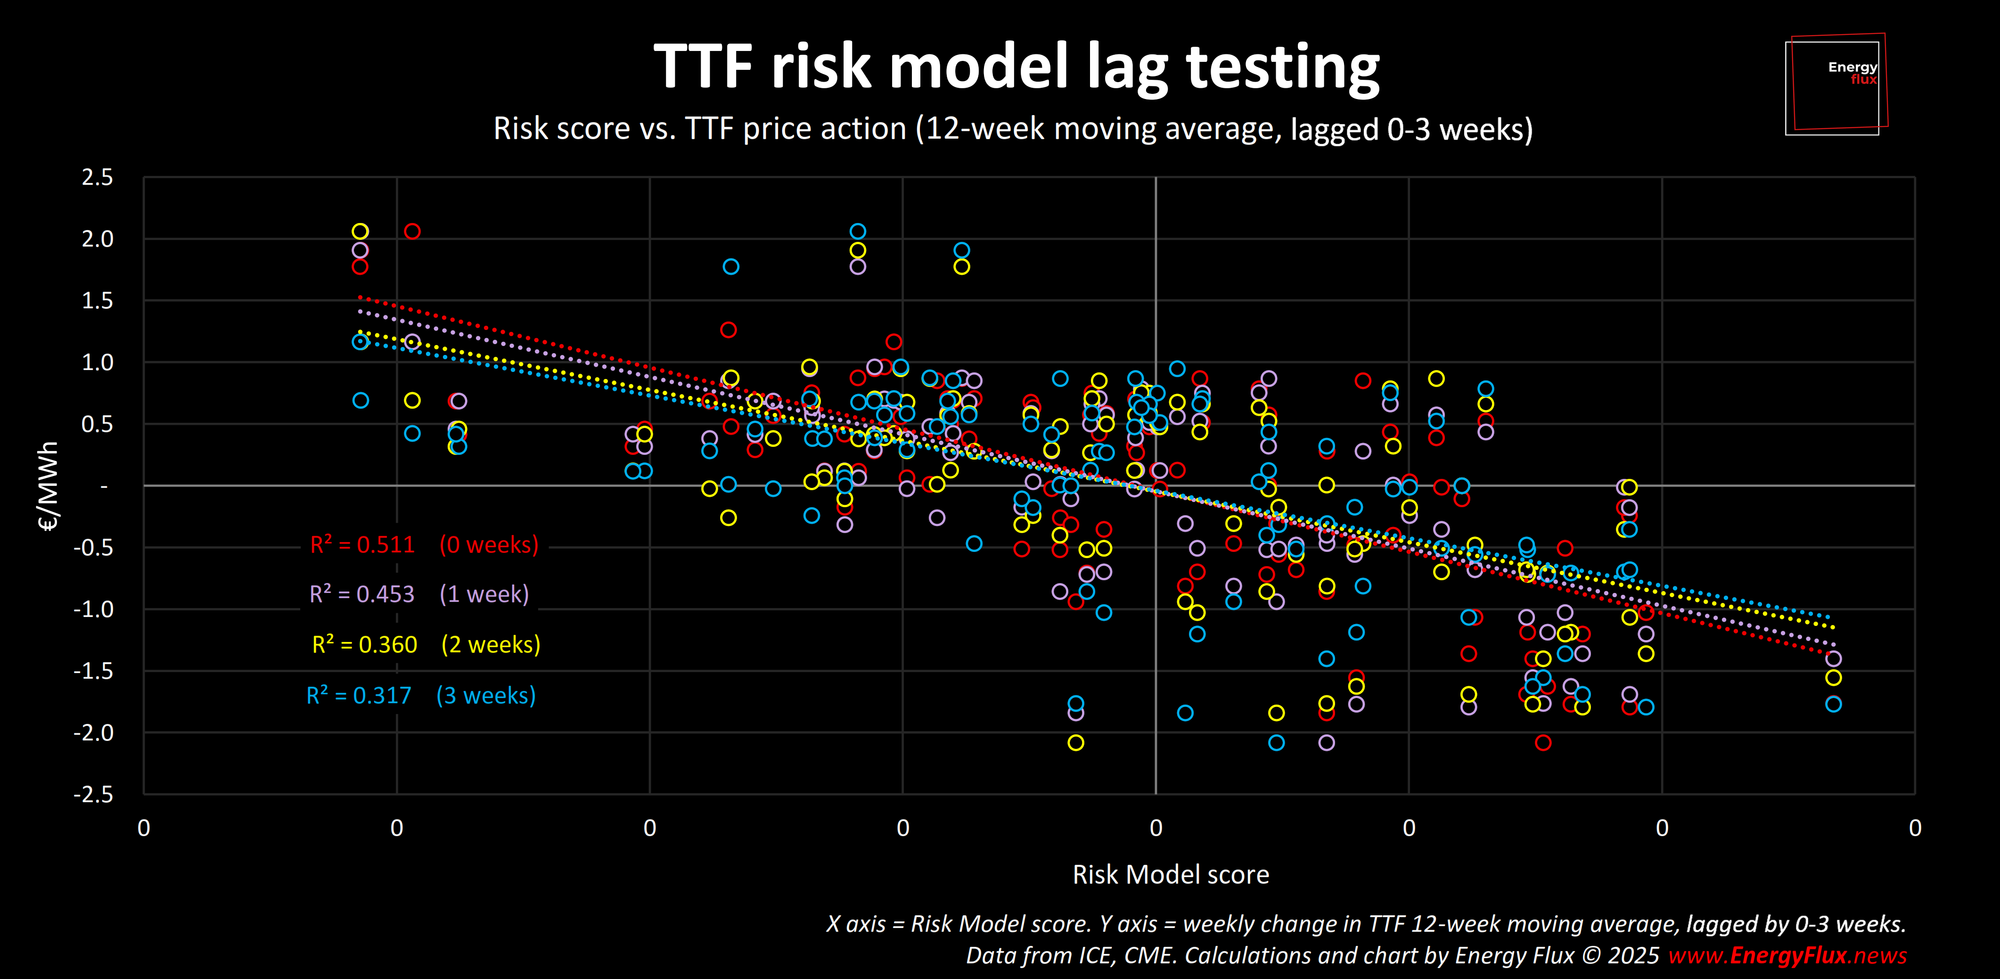
To test its ability to predict price action, I conducted lag testing: regression analysis of Risk Score against future TTF price movements printed one, two, and three weeks ahead. As the chart below shows, the R-squared value drops off somewhat the further out you look.
That suggests the model does a good job of capturing how risk is priced in the market at any given time, while retaining some predictive power.
But when we isolate just the hedge fund component of the model (i.e. the 12w MA of weekly changes in net positions held by investment funds), something else emerges.
The hedge fund signal holds up even when we test it against future TTF price changes. One week forward, the R² is still strong at 0.43, and it remains above 0.4 even three weeks out. That’s notable.
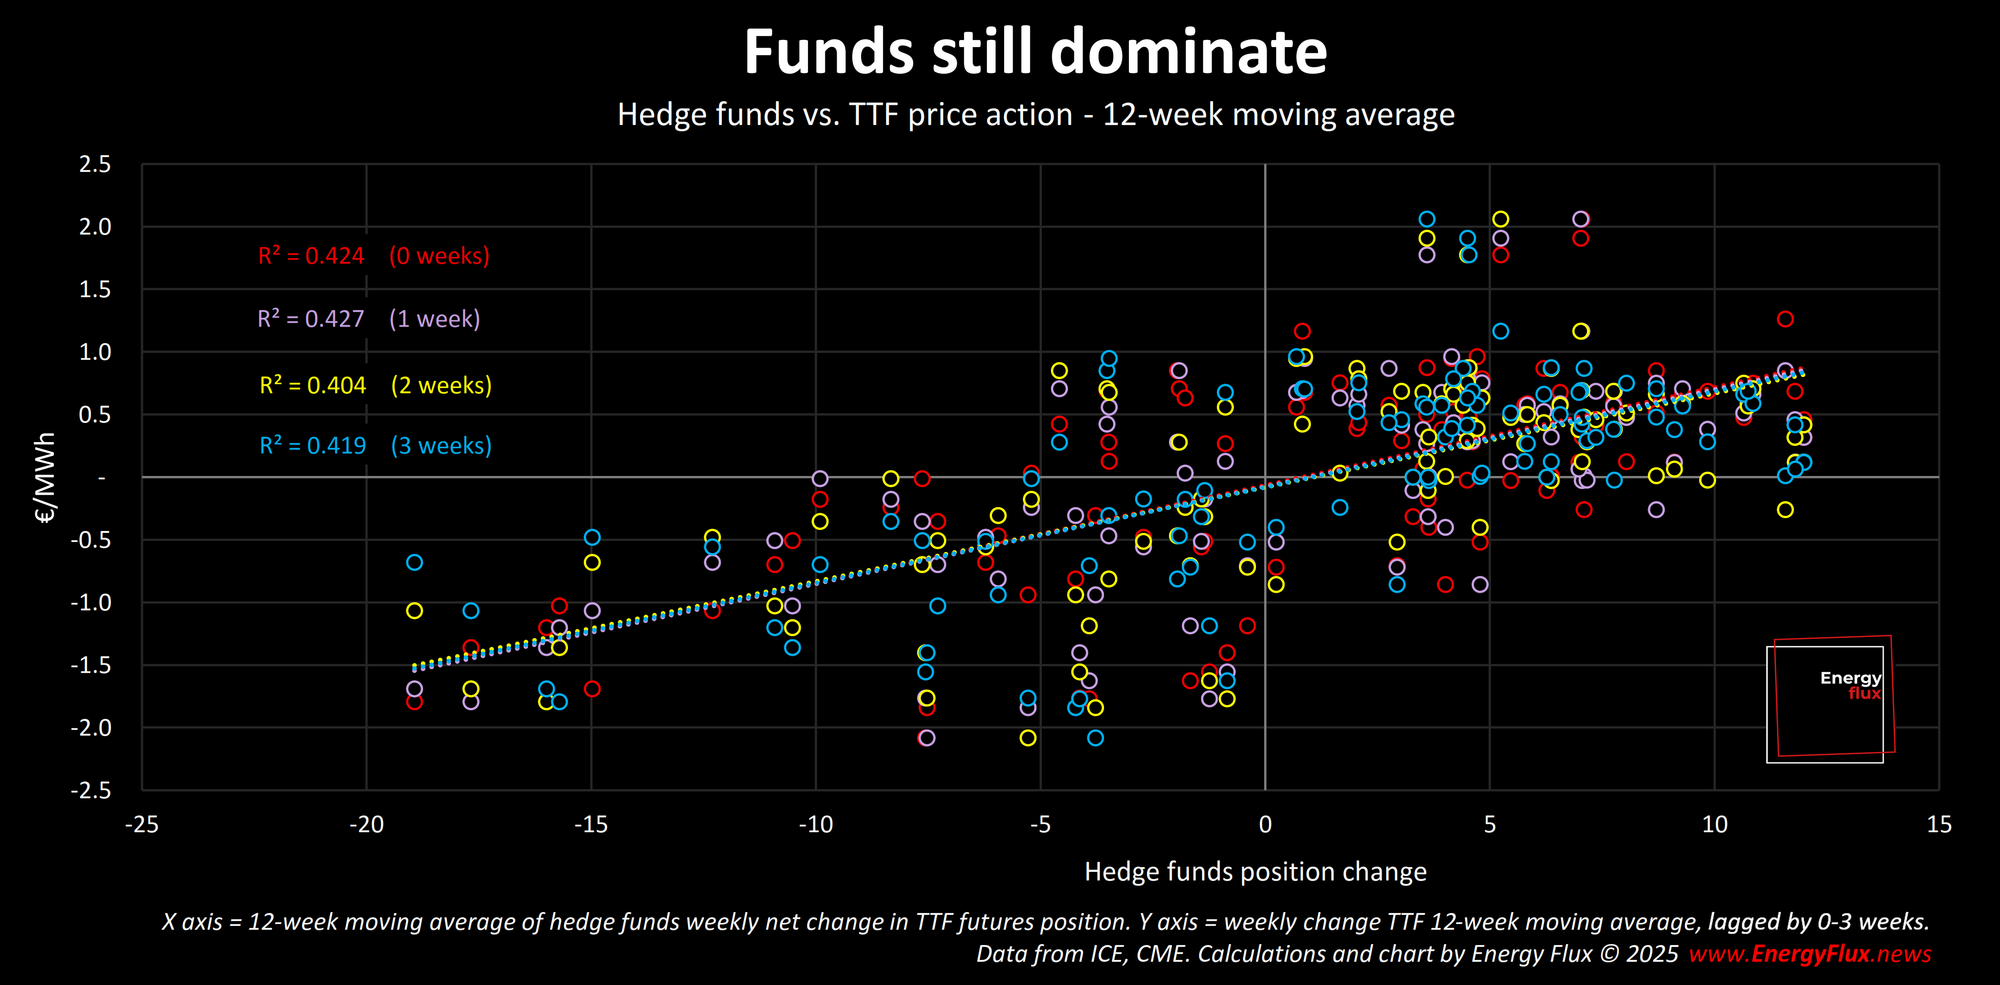
What this tells us is that hedge fund positioning alone may contain some forward-looking insight. These traders appear to move ahead of the market at times, positioning for price shifts that haven’t yet occurred (whether this is because hedge fund’s big bets move the market or anticipate it, is an open question).
By contrast, the full risk score — which blends hedge fund data with other signals like futures curve structure and commercial hedging — has the strongest correlation with current market pricing, but fades more quickly as a forward indicator.
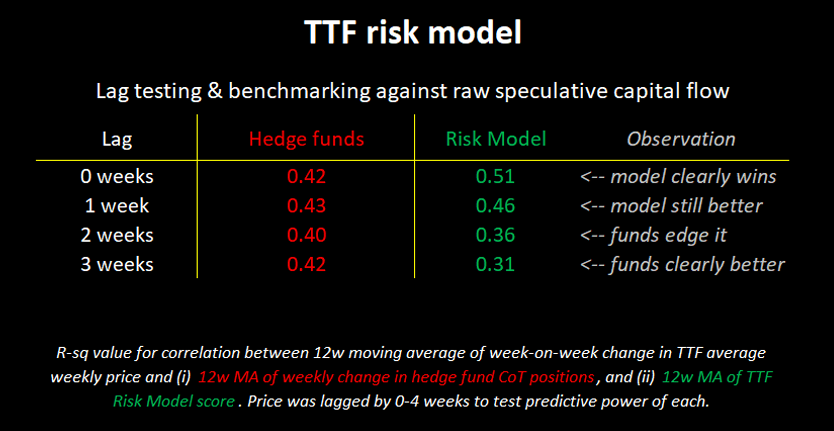
In simple terms:
The Risk Model is best at telling us where we are.
The hedge fund signal may offer clues about where we’re going.
This distinction is important. It suggests that combining the two — using the model for regime context and hedge fund activity for directional cues — could be more powerful than using either alone.
So, what does it tell us?
The updated TTF Risk Model, now using rolling 12-week averages to smooth out noise, is beginning to reveal clear signals of underlying regime shifts in European gas markets.
As shown in the chart below, the model doesn’t just track sentiment — it appears to illuminate structural changes in price direction with notable consistency...
The TTF Risk Model is a premium feature that will be incorporated into future editions of the Chart Deck. It will be accessible to readers on the Chart Deck and Premium subscription tiers only.
If you’re not already a subscriber, why not avail yourself of the 7-day free trial to get a feel for the premium Energy Flux offering?

Member discussion: TTF Risk Model v2.0
Read what members are saying. Subscribe to join the conversation.