Weaponising the fog of war
Markets can’t price what they can’t see. And right now, nobody can see anything.

Last week, Energy Flux laid out the case that gas markets are catastrophically mispricing the supply shock unfolding in the Middle East. That thesis has not been borne out in the markets. Not because it was wrong, but because the mispricing has gotten worse.
Dutch TTF front-month, the European gas benchmark, traded sideways again last week. The risk premium deflated. At the time of writing, the prompt contract is again trading below €50/MWh. And yet the physical realities underpinning the most severe LNG supply disruption in modern history have not changed. If anything, they have hardened.
The Strait of Hormuz remains closed to LNG transits. Qatar’s force majeure on LNG exports is still in effect. The last pre-war cargoes loaded from the Middle East are now discharging at their destinations. After that, there are no more. And Donald Trump’s latest rambling address did nothing to clarify war aims, de-escalation timelines, or the path to reopening the world’s most critical energy chokepoint.
So here is the question every analyst is being asked right now: why aren’t prices higher?
Dissecting the usual suspects
Several theories are circulating. Financial markets are structurally better at pricing risk than pricing physical disruption. Futures capture probabilities, not the grinding cumulative impact of molecules not arriving at terminals.
Asian demand destruction is doing heavy lifting: South and Southeast Asia are in full crisis mode, China has halted spot LNG imports until at least the summer, and the result is a grotesque replay of 2022 where developing economies absorb the pain so Europe can keep buying at tolerable prices.
These contribute at the margin. But the theory I find most compelling is simpler: the sheer incoherence of US policy is paralysing price formation.
Trump Always Chickens Out, except when he doesn’t
War fatigue is setting in. More specifically, TACO fatigue: the exhaustion of trying to extract signal from an endlessly contradictory stream of pronouncements, Truth Social posts, and deadlines that melt into irrelevance as soon as they are uttered.
Traders cannot price what they cannot parse. The result is a market caught in a bizarre holding pattern: funds are building record long positions because the physical fundamentals demand it, but prices refuse to follow because nobody can model the trajectory of a conflict whose architect cannot articulate its own endgame.
Every Truth Social post is a potential reversal trigger. So the smart money positions structurally long while the spot market treads water, waiting for clarity that never arrives.
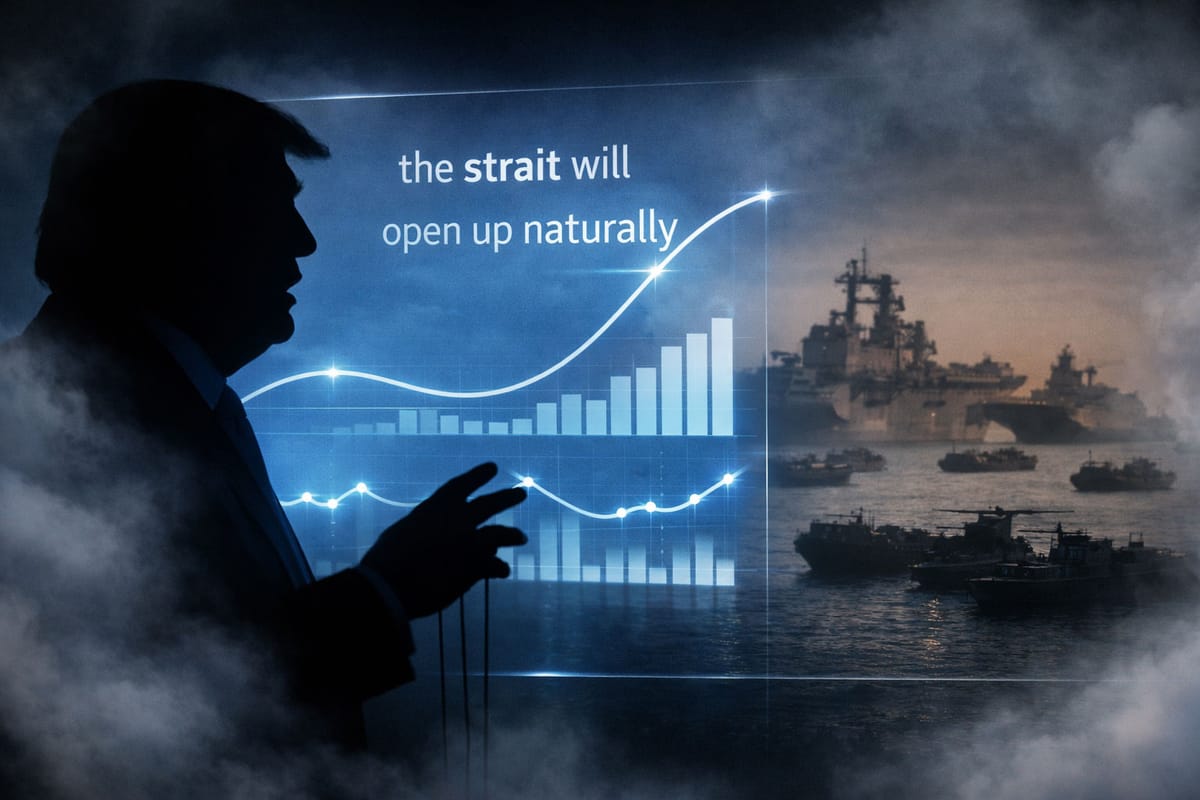
Trump’s big speech last night was supposed to provide that clarity. It did the opposite. On the single most important question facing energy markets — when and how does Hormuz reopen? — this was the answer:
“And in any event, when this conflict is over, the strait will open up naturally. It’ll just open up naturally. They’re going to want to be able to sell oil because that’s all they (Iran) have to try and rebuild. It will resume the flowing and the gas prices will rapidly come back down.”
‘It will sort itself out.’ That is the entirety of the post-war Hormuz plan as articulated by the President of the United States. No framework for transit security. No multilateral arrangement. No detail on who controls the strait, who guarantees passage, or how the world’s most critical energy chokepoint transitions from active war zone back to functioning trade route. Just: it’ll open up naturally.
I broke it, you fix it
It gets worse. For countries struggling to source fuel, many of which declined to join what Trump calls “the decapitation of Iran”, the suggestion was equally unedifying:
“Go to the straight and just take it, protect it, use it for yourselves. Iran has been essentially decimated. The hard part is done, so it should be easy.”
‘Just take it.’ ‘It should be easy.’ Leaving aside the obvious fact that it has proven impossible for the world’s most powerful naval force, this is not a de-escalation framework. It is an invitation for uncoordinated military adventurism in the world’s most volatile waterway, delivered with the strategic depth of a petulant toddler.
Unless Trump is willing to make enormous concessions — leaving Iran in full control of Hormuz transits, resilient to internal dissent, and emboldened against future external aggression — the conflict has no off-ramp. He has broken Hormuz and is now buying time for a decisive escalation, dressed up in maddening rhetoric that is faux-reassuring and inflammatory in equal measures.
US withdrawal from Iran is militarily impossible without owning a humiliating defeat of Trump’s own making. That is the galling geostrategic reality. And it explains the extraordinary divergence between what funds are doing and what prices are saying.
The smart money is screaming
Investment funds extended their net long position in TTF gas futures to 323 TWh last week — an all-time high, smashing the previous record set in February 2025. Hedge funds and other money managers have added 214 TWh of net length in just four weeks, the fastest accumulation in TTF history (slide 22-23).
Shorts are being closed at record pace. The long-short ratio, already in uncharted territory, has hit an unprecedented 4:1 (slide 33). Funds are unambiguously positioned for an explosive upward correction, even as spot prices drift sideways in the fog of war.
Yet some unwinding is almost guaranteed this week. Weekly average TTF fell even as funds added record length, a divergence that is unsustainable. Expect tactical profit-taking and selective re-opening of shorts, while funds retain core exposure to further escalation, including widespread speculation of a US ground incursion into Iran in April.
A subtle shift along the curve
The latest output from the Storage-Speculation regression model reveals something critical. Last week, the model identified funds betting on a multi-year European energy crisis, concentrated in long-dated 2028 contracts. This week, it signals a resumption of trading activity in near-dated 2026 and 2027 calendar month futures (slides 40–43).
The implication: funds are reassessing how they price risk along the curve. If Hormuz is somehow reopened sooner rather than later, the immediate priority snaps back to Europe’s immediate gas storage restocking challenge — in which case, the curve still holds plenty of upside potential.
The Chart Deck in brief
The full 95-slide Chart Deck unpacks these dynamics in granular detail. Here are some of the standout signals:
💥 European complacency is deepening. TTF has sold off and the risk premium has deflated, even as the geostrategic case for higher prices strengthens (slides 9–14). The disconnect is stark.
💥 Storage is low, and refilling it will be expensive. EU storage exited winter at 28% full — not as dire as the 25.5% recorded in 2022, but challenging. Reaching the EU’s stated 80% target by 1 November requires injecting approximately 594 TWh over the next seven months, implying a daily injection rate of roughly 2.8 TWh — well above the historical average of 2.0–2.5 TWh/day (slides 48–51).
💥 The restocking bill: between €20 billion and €33 billion, depending on whether TTF averages €34/MWh or €55/MWh over the injection season. And flat seasonal spreads are actively disincentivising injections, compressing the economic case for building inventory precisely when Europe needs it most (slides 15–16).
💥 The Atlantic-Asia arbitrage window is barely open. TTF’s discount to JKM has cracked open the US-Asia arb on the front month, but the rest of the 2026 curve remains largely closed (slides 60–63). Asia demonstrably needs cargoes, so why? Likely a combination of term-contract lock-ins at fixed differentials, demand destruction suppressing spot appetites, and shipping logistics still adjusting to longer voyage routes.
💥 Stalling LNG freight rates compound the picture. The cryogenic vessel market is caught between excess tonnage from Qatari shut-ins and the clear need for longer, more circuitous voyages (slides 70–73).
💥 Notable vessel movements tracked in the deck reveal the extent of trade flow distortions now rippling through the global LNG fleet, with granular cargo-level data on re-routing patterns and destination shifts as the market adapts to the loss of Middle Eastern supply (slides 80–84).
💥 The TTF Risk Model is still flashing Bullish Risk Underpriced, although the signal has tapered slightly from last week’s record score (slides 88–90).
💥 LNG demand is being destroyed. The modest improvement in the TTF Risk Score stems from a slightly less alarming LNG Balance Index reading, presumably as demand destruction begins to register in the physical flow data (slide 83).
Get the full picture
This free overview barely scratches the surface. The full 95-slide Chart Deck, available as a downloadable PDF and PPSX slideshow, contains the complete analytical framework: every proprietary model output, curve structure analysis, positioning breakdown, and contextualised storage inflow data that underpin the conclusions above.
If you are making decisions in these markets, or advising those who do, this is the week to have the full picture in front of you.
👇 DOWNLOAD: 95 slides in .ppsx and .pdf format 👇

Member discussion: Weaponising the fog of war
Read what members are saying. Subscribe to join the conversation.