Bears tighten grip on TTF
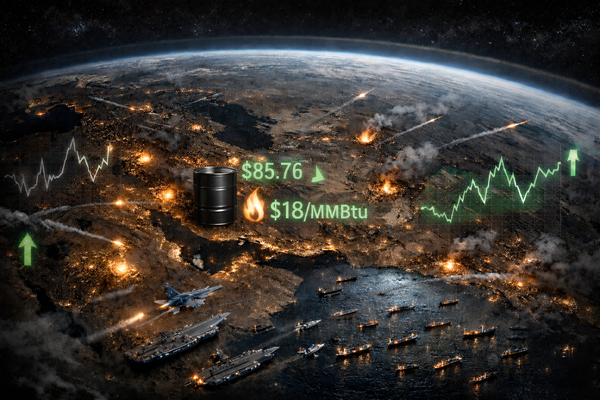
EU gas bear market spells trouble for LNG exporters | Chart Deck — 4 Dec 2025

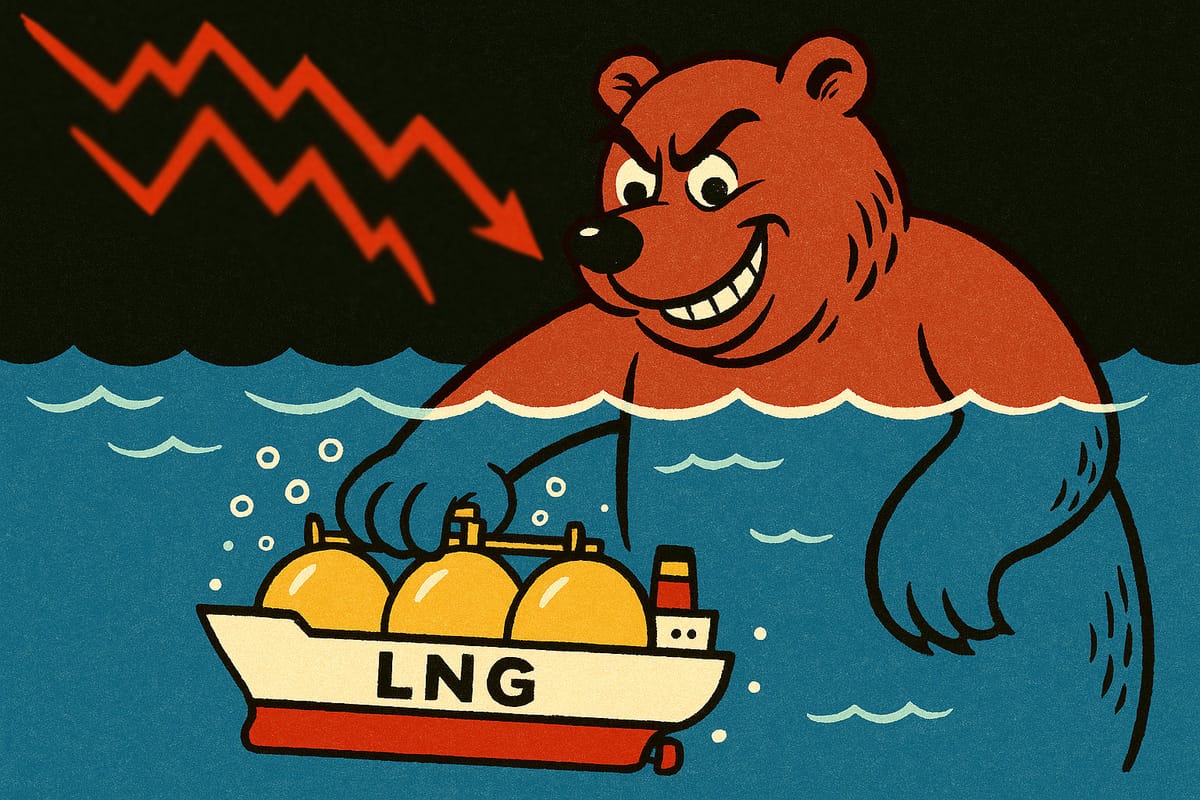
All data points in this week’s Chart Deck indicate the EU gas market is firmly in an LNG glut bear cycle.
The global LNG market is now oversupplied by 2.4 million tonnes, up from 1 mt just a week earlier, as surging supply outstrips demand growth.
The dramatic collapse in China’s LNG imports (-12 mt yoy) combined with surging supply growth (+15 mt yoy) eclipse Europe’s increased imports (+23 mt), inflating the physical surplus.
Investment funds deepened their net short position in TTF futures last week to -50 TWh, and accelerated their overall EU gas exposure. There are now 454 hedge funds trading TTF futures with a total aggregate exposure (long plus short) of 932 TWh — both record highs.
At the same time, commercial players continue buying the dip. Commercial Undertakings unwound short positions at a near-record rate to extend their net long position to +207 TWh — a four-year high.
The TTF front month and futures curve softened further despite rapid depletion of EU gas stocks drive by heightened heating demand. TTF dipped briefly below €28/MWh earlier this week as markets price in the possible return of Russian gas to Europe, while discounting the EU’s own ban on Russian gas and LNG.
This view is probably half-right; peace in Ukraine remains a distant prospect and resumption of Russian pipeline flows would face many months of delays and entrenched political opposition.
At the same time, the EU ban is riddled with compromise that will diminish its potential market-tightening impact, if indeed it survives a legal challenge from Hungary and Slovakia in the European Court of Justice.
For now, however, geopolitics are taking a back seat as fundamentals are driving market sentiment and directionality. The €30/MWh support line is now a firm resistance level that will only be broken by a sustained recalibration of the supply-demand balance.
Risk of a short-covering correction, as flagged previously, is ever-present. A confluence of harsh winter, unplanned supply outages and a reassessment of geopolitical realities is well within the realm of possibility. These risks are captured in the Energy Flux TTF Risk Model, which is continues signalling that bullish risk is moderately underpriced.
As the glut gathers steam, the economics of US LNG are deteriorating at an alarming rate. Delivered cost in Asia for next winter is approaching spot price parity, while delivered cost in North-west Europe is priced to converge with EU hub prices as early as May 2027.
This week’s downloadable Chart Deck contains 60+ slides that dig into the factors driving bearish sentiment, how positioning has shifted across the curve, and what the risk indicators suggest about the durability of the short move.
If you want the full picture of how trader sentiment, market risks, economics and cargo flows are lining up as winter unfolds, it’s all in this jam-packed datavis-heavy Chart Deck:
Highlights (click to expand):
- EU gas market is firmly in LNG glut bear cycle (slides 7-8)
- Global LNG oversupply widens to 2.4 mt, up from 1 mt a week earlier (slide 57)
- Investment funds deepen TTF net short position, amid fire sale of commercials’ short (slides 18-30)
- TTF front month & futures curve soften further despite rapid storage depletion (slides 9-17)
- US LNG delivered cost in Asia nears spot price parity (slide 45)
- US LNG delivered cost in NW Europe converges with EU hub prices from May 2027 (slide 55)
- Global FOB netbacks retrace as freight rates ease further (slides 38-39)
- TTF Risk Model points to moderate underpricing of bullish risk (slides 31-35)
💥DOWNLOAD: 60+ slides in .ppsx and .pdf format

Member discussion: Bears tighten grip on TTF
Read what members are saying. Subscribe to join the conversation.