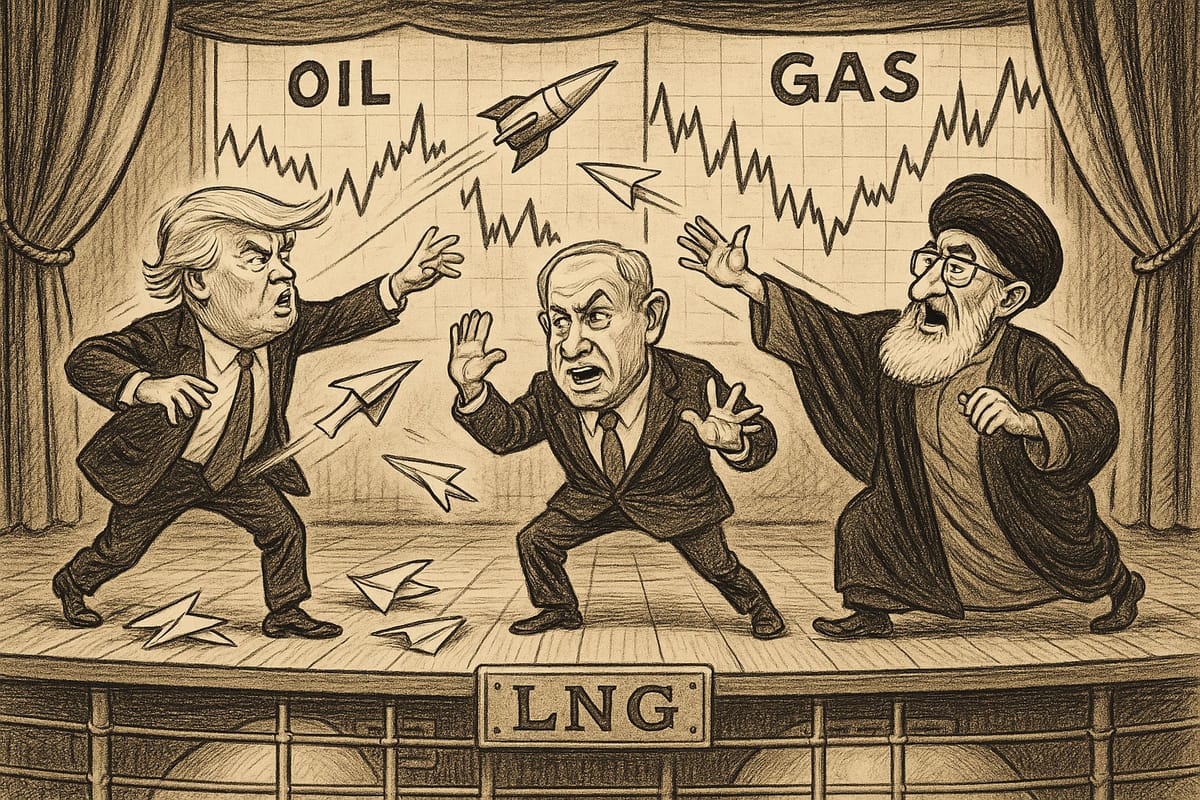
Geopolitical theatre
TTF bull trap turns investment funds into bag holders | EU LNG Chart Deck: 26 June 2025

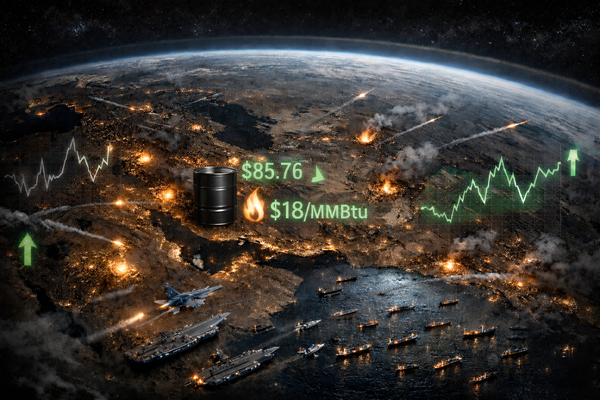
They say that war is conducted in a theatre of operations. The events of the last fortnight gave that maxim new meaning.
The Middle East conflict reached a dramatic crescendo on Monday in what can only be described as a coded performance of missile diplomacy.
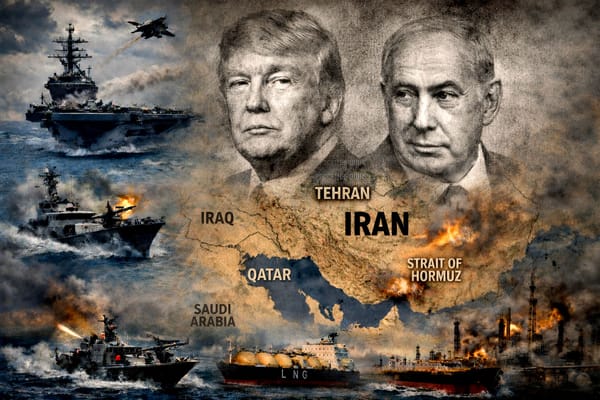
After Sunday’s US bombardment of (what many believe to be empty) Iranian nuclear sites, the world watched transfixed as Iran mulled its response.
Tehran promised fire and brimstone. On Monday, projectiles rained down on an American airbase in Qatar and another in Iraq. But neither caused any real damage.
This ‘retaliation’ was in fact a face-saving gesture intended for a domestic audience in Tehran. The real message telegraphed to Washington: we want to de-escalate, but must be seen to be taking a hard line.
Eagle-eyed traders saw straight through it. Strait of Hormuz closure risk had always been slight at best, they calculated, so if Iran was subtly signalling for a truce then Hormuz is open for business.
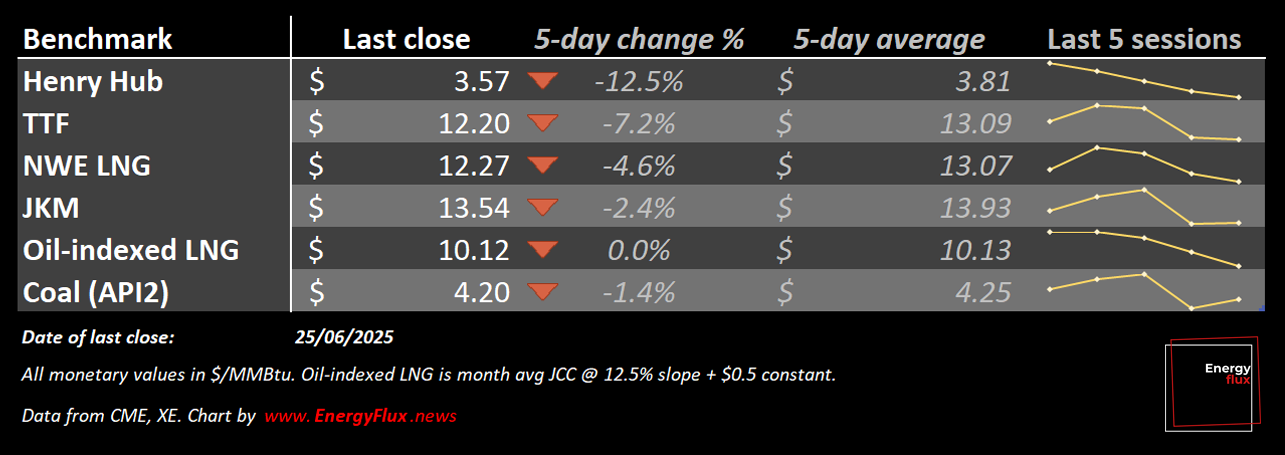
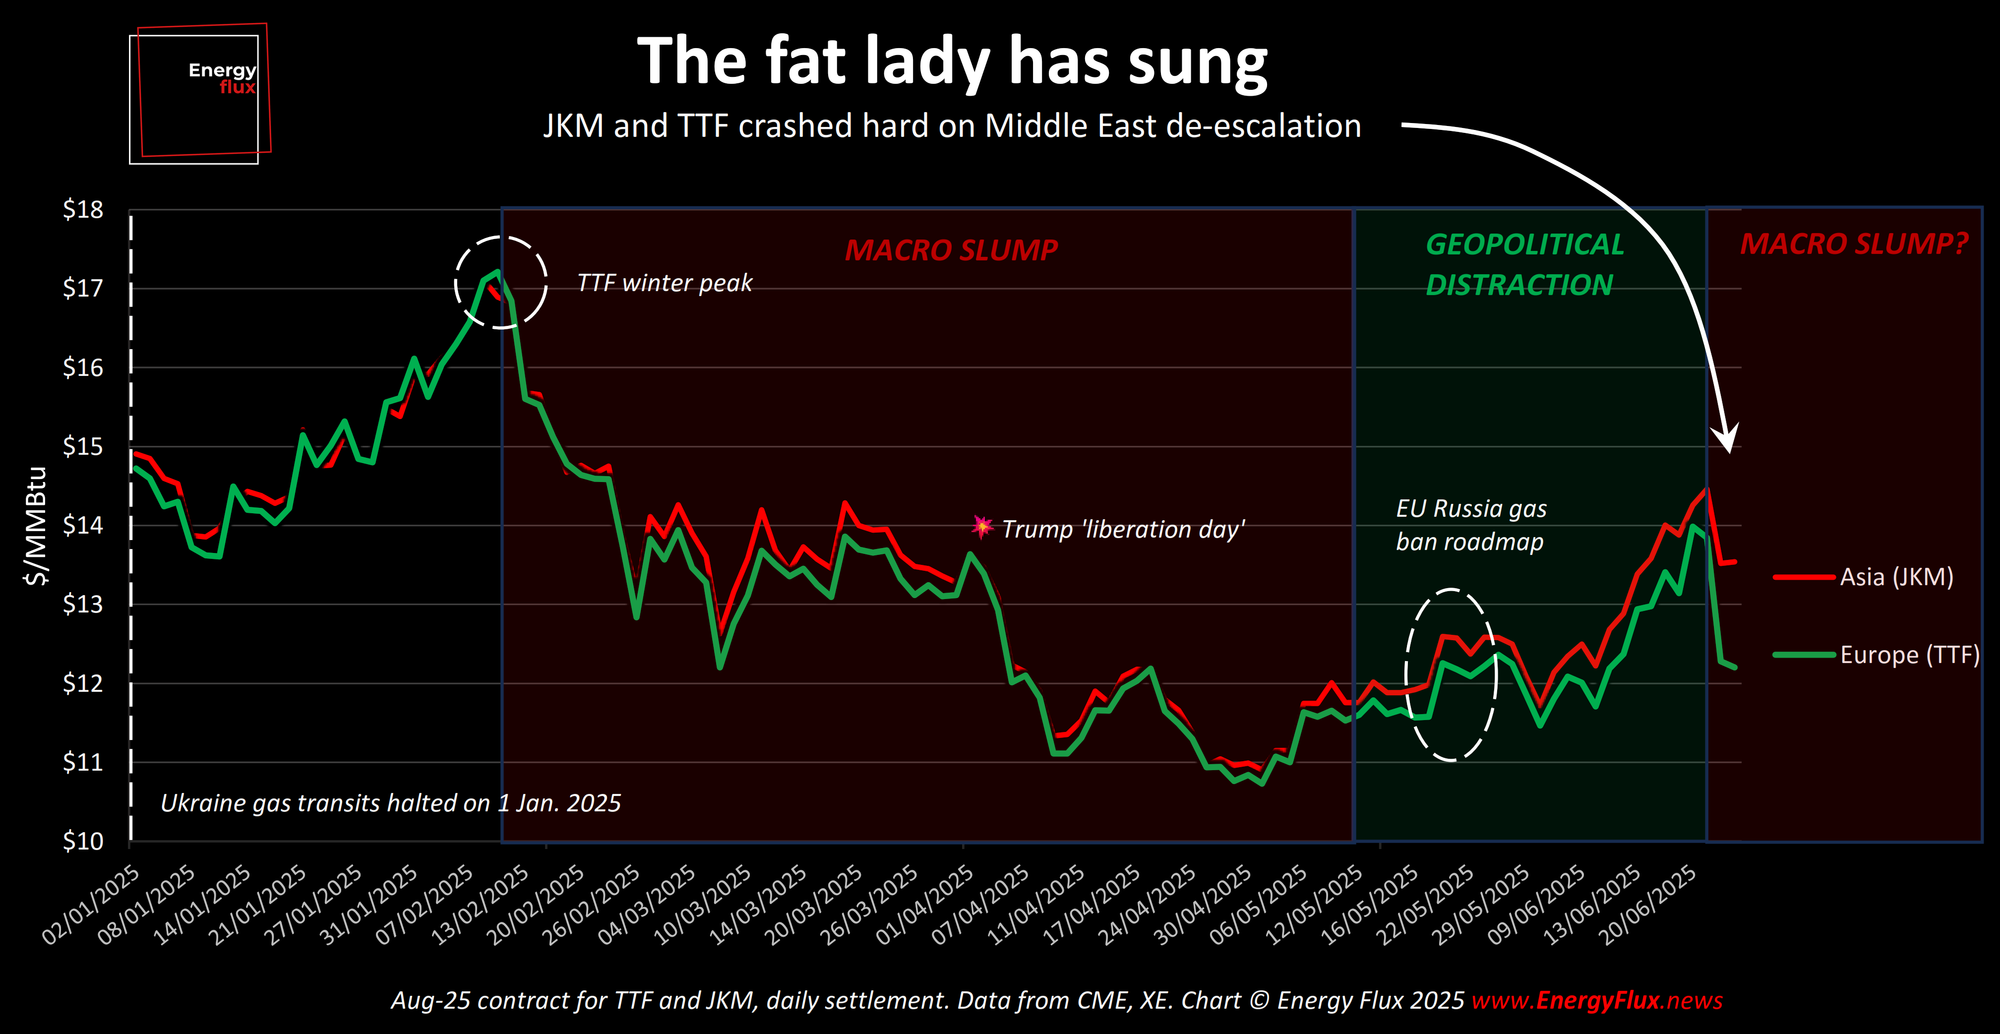
With no rationale to support the inflated risk premium, Tuesday’s sell-off was spectacular. Dutch TTF plunged 10% and JKM, the Asian LNG spot benchmark followed suit.
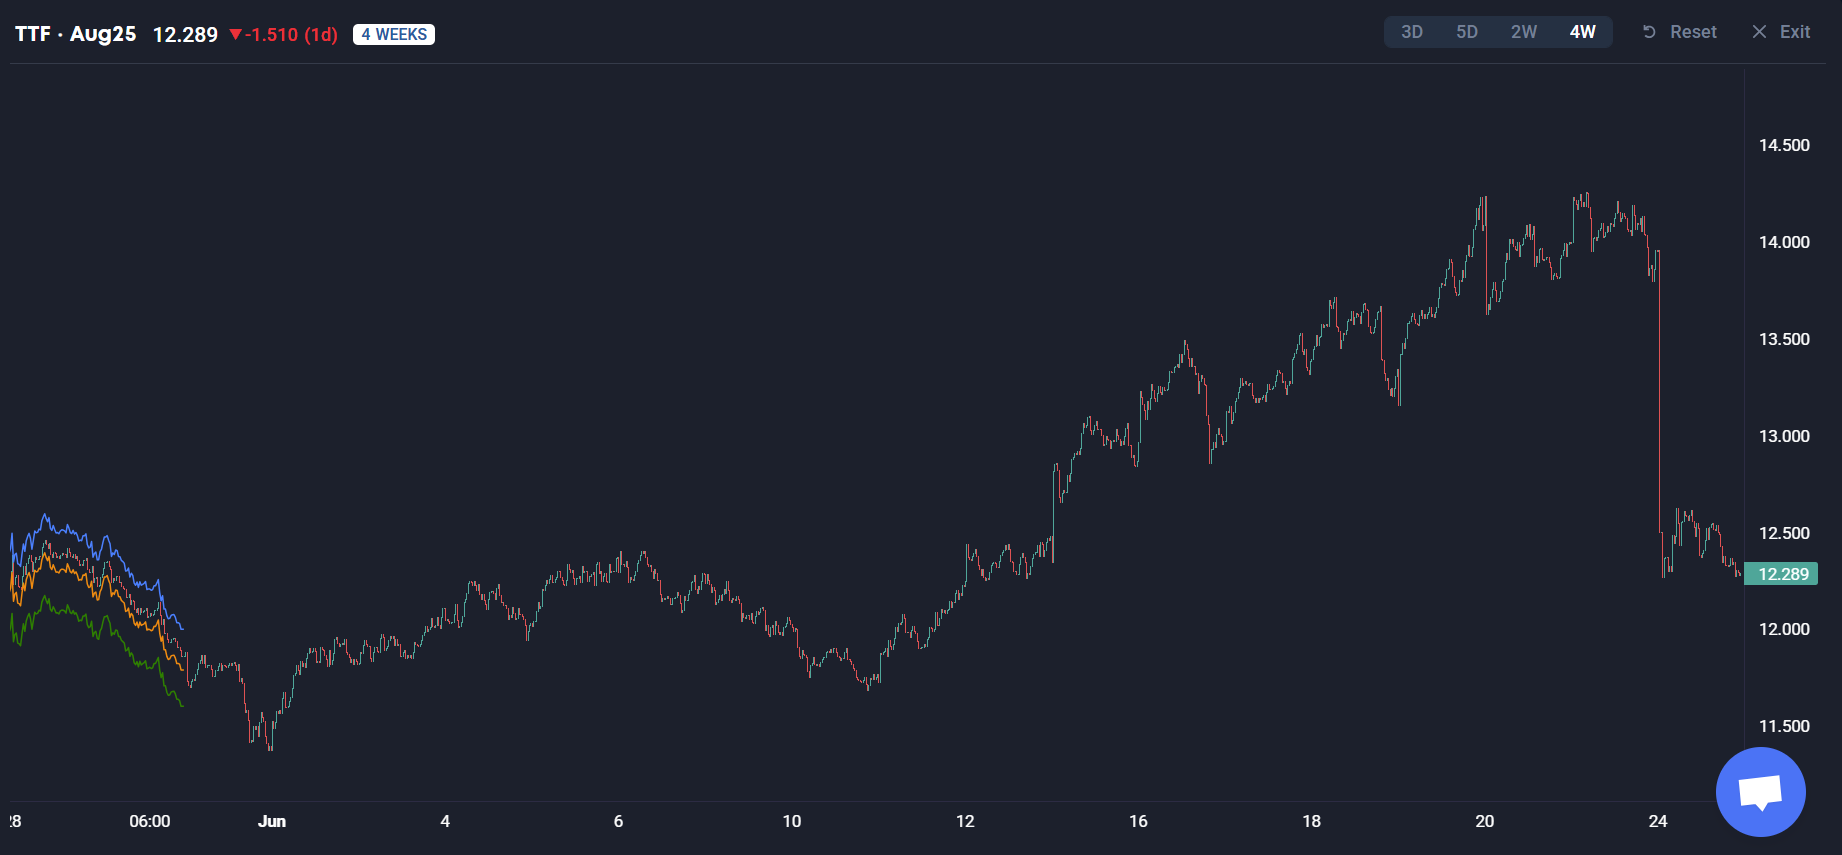
The correction was so deep that front-month prices fell below where they were prior to Israel’s surprise aerial assault on Iran on 13 June – and, so far, have stayed there.
Level up your market insight. Subscribe to Energy Flux and support fiercely independent market analysis
This week’s EU LNG Chart Deck runs the rule over:
✅ The geopolitical ‘bull trap’ that turned investment funds into bag holders
✅ How dramatic price action has shifted global LNG trade dynamics
✅ The outlook for winter & next summer in light of the EU’s new gas storage proposal
If you want to go deep into fast-moving global gas market dynamics, this post is for you.
💥 Article stats: 1,600 words, 10-min reading time, 16 charts and graphs

Member discussion: Geopolitical theatre
Read what members are saying. Subscribe to join the conversation.