Hormuz closure triggers record TTF liquidation
Gas and LNG prices surge, as the storage-speculation nexus lights up along the forward curve


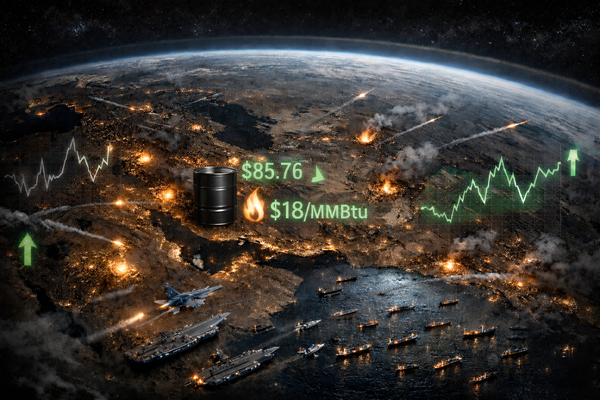
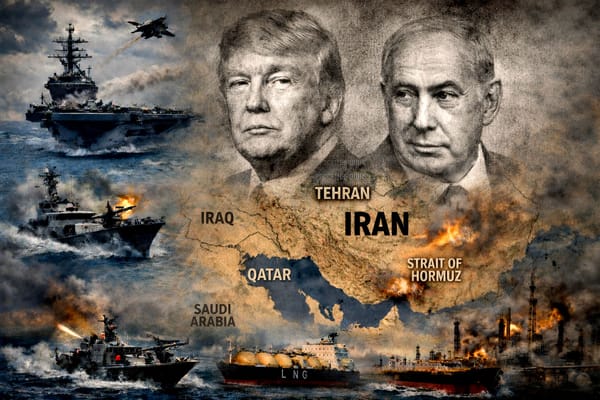
The sudden closure of the Strait of Hormuz has forced global gas markets into a rapid and painful reassessment of risk. In a matter of days, traders have had to price a scenario that until recently sat firmly in the realm of tail risk: a disruption to Persian Gulf LNG exports at the very moment Europe is preparing to refill storage after a difficult winter.
Markets are still struggling to determine whether this shock represents a temporary disruption or the start of a much more serious tightening of global gas balances. The initial reaction has been chaotic. Prices surged, freight markets exploded, and LNG trade flows began to shift as Atlantic Basin cargoes chased higher netbacks in Asia. But the deeper story now emerging is not just the price spike itself. It is how different market participants are positioning for what comes next.
Everything must go: funds ignite fire sale
The Hormuz closure has triggered the most violent repricing in European gas futures since Russia’s invasion of Ukraine in 2022. In the week ending 6 March, investment funds trading on ICE Endex executed one of the largest repositioning moves ever recorded in TTF.
Shorts were slashed by 202 TWh and longs were reduced by 127 TWh, resulting in 330 TWh of gross exposure liquidated in total. The net effect was a +75 TWh swing toward net-long positioning, pushing fund exposure from +121 TWh to +196 TWh, the highest level since February 2025 (slides 21-27).
This was not a routine shift in positioning. It was a rapid risk reset. Funds were caught off guard by the scale of the geopolitical shock and moved quickly to reduce exposure while covering shorts. The result was the largest gross liquidation event on record in TTF futures.
Price action reflected the shock. Front-month TTF jumped €20/MWh week-on-week to settle at €52.29/MWh on 6 March, spiked to €55.49/MWh on 9 March, retreated to €46.71/MWh on 10 March as the Trump administration sought to ease jitters, then rebounded to €49.29/MWh yesterday when oil tankers were set ablaze near Iraq (slide 11). The forward curve remains elevated across all tenors and in backwardation, reflecting deep uncertainty over how long the disruption will last (slides 17-18).

Funds move first, commercials recalibrate
Speculative capital moved aggressively. Commercial market participants exercised caution.
Commercial gas operators recorded a mere +0.75 TWh net change in positioning during the same week. At first glance that suggests stability, but the underlying flows tell a different story. Within commercial portfolios there was a ~75 TWh internal rotation (slides 28-33).
Risk-reduction hedges increased by +38 TWh, effectively lifting some upside protection and allowing greater exposure to rising prices. At the same time, discretionary trading books sold longs and added shorts totalling −37 TWh, positioning against the geopolitical rally (slide 30).
The offset between those two books left the overall commercial position largely unchanged. In practical terms, physical players hedged their underlying exposure while opportunistically trading the volatility created by the Iran shock.
The divergence is telling. Funds repositioned around a new geopolitical risk regime. Commercial participants treated the price spike as a trading opportunity while keeping their physical portfolios balanced.
Europe & Asia struggle to price shock
Gas markets are struggling to price a disruption whose duration is unknown.
In the immediate aftermath of the Strait closure, European gas prices surged relative to Asian LNG benchmarks. On 3 March, front-month TTF briefly traded at a $2.22/MMBtu premium to JKM. That spread widened above $5/MMBtu on Monday as TTF spiked close to $19/MMBtu while JKM traded around $13.5/MMBtu (slides 12-14).
The gap then closed almost entirely by 10 March as Asian prices caught up. These violent swings reflect a market grappling with two competing possibilities: a short-lived disruption that quickly reverses, or a prolonged outage that forces Europe and Asia into direct competition for flexible LNG cargoes.
The forward curve currently suggests the latter risk is rising. JKM is trading at a $1.86/MMBtu premium to TTF for May, $1.69/MMBtu in June, and $1.10/MMBtu in July, indicating growing competition for summer LNG supply.
Freight markets reinforce that signal. Charter rates for 174,000-cm LNG carriers surged from roughly $20,000/day a month ago to nearly $300,000/day on 5 March, before easing back to around $200,000/day. The surge reflects both disrupted Gulf traffic and longer voyages as cargoes reroute around the Cape of Good Hope (slides 43-45).
Storage economics: refill problem gets harder
Europe enters this crisis from an already weak storage position.
EU gas inventories stood at 334.7 TWh on 9 March, equivalent to 29.3% full. A year earlier storage was 420.4 TWh (36.6%), leaving a deficit of roughly 86 TWh. Relative to the long-run seasonal average, storage levels are 11.8 percentage points below normal (slides 46-49).
The refill task is demanding even without supply disruption. To reach the EU’s 90% storage target by 1 November, the system must inject roughly 694 TWh over about 235 days, implying an average injection rate close to 3 TWh per day. During the 2025 refill season, peak injections averaged around 2.5 TWh/day.
At the same time, the forward curve is now working against storage operators. Front-month TTF settled at €46.71/MWh on 10 March, compared with €45/MWh three months forward and €44.12/MWh six months out. Summer 2026 contracts average roughly €46/MWh, while Winter 2027 trades closer to €43/MWh (slides 15-16).
This backwardated structure undermines the traditional storage trade. Buying gas today for injection and selling winter futures locks in a loss on paper. Procuring 694 TWh at a negative seasonal spread of -€3/MWh implies a carry loss of €2 billion. Without regulatory pressure or government intervention, the price signal is discouraging injections at precisely the moment Europe needs them most.
The Storage-Speculation Nexus shifts down the curve
The most revealing signal from the data may not be the price spike itself, but where speculative capital is moving next.
The Energy Flux Storage-Speculation Nexus regression model, which tracks the relationship between fund positioning and movements along the TTF curve, shows a clear shift in behaviour.
Until recently, the strongest correlation between fund flows and price movements was concentrated in the prompt and Summer-26 contracts. That pattern has now begun to change.
In the week to 6 March, the correlation between fund positioning and the March-26 contract dropped sharply, with the R-squared falling from 0.65 to 0.47. Similar weakening appeared across the near curve.
Further along the curve, however, correlations strengthened. The March-27 contract rose from 0.22 to 0.36, while April-27 increased from 0.02 to 0.19 (slides 40-41).
In short, speculative attention is migrating down the curve.
Funds increasingly appear to be pricing a scenario in which Europe avoids aggressive buying during the current refill season because prices are too high, enters Winter 2026 with depleted inventories, and faces an even more severe refill challenge in Summer 2027.
Parsing the risk of binary outcomes
The Energy Flux TTF Risk Model captures a market caught between two competing narratives (slides 35-38).
On one side is the expectation that the Strait of Hormuz disruption proves temporary. If shipping resumes and Qatari LNG flows return quickly, the price spike will fade and the structural LNG surplus expected later this decade will reassert itself.
On the other side is the possibility that the disruption persists for many months, or that Qatari LNG exports never quite recover. In that scenario, the loss of Gulf exports would tighten global LNG balances just as the Northern Hemisphere moves toward winter.
The latest TTF Risk Model run reflects that tension. Fund positioning signals have shifted sharply after the large repositioning visible in ICE data, indicating that speculative capital is no longer comfortable maintaining large short exposures.
At the same time, parts of the forward curve continue to trade as if the disruption may prove temporary. The resulting Risk Score signals elevated risk but not outright panic (slides 35-38).
Markets are no longer pricing a single outcome. They are pricing two radically different futures at once.
Seb Kennedy | Energy Flux | 12 March 2026
You read the commentary. Now get the data. Unlock instant access to this week’s 90-slide Chart Deck and see for yourself what the positioning, flows and curves actually say — not what the market is shouting.
💥 DOWNLOAD: 90+ slides in .ppsx and .pdf format 👇

Member discussion: Hormuz closure triggers record TTF liquidation
Read what members are saying. Subscribe to join the conversation.