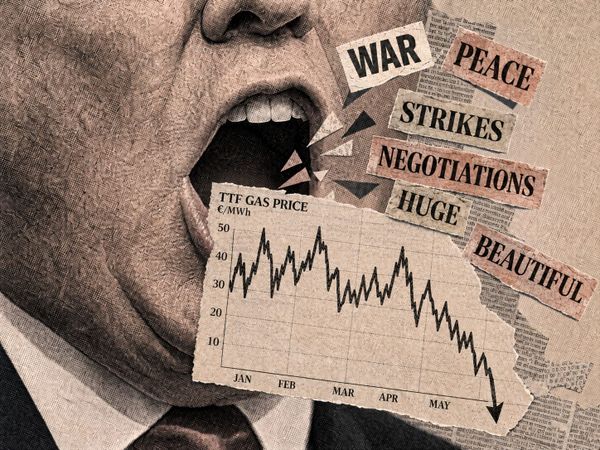
Priced for peace?
Markets have priced the US–Iran ceasefire as a fully-fledged peace deal. The 60-day clock, and our models, suggest otherwise.


The US and Iran have signed their peace memorandum, and a 60-day clock is now running. I set out my unvarnished view of the deal itself in this week’s Liberatión interview. This is about the narrower question that actually moves gas and LNG prices: the odds that 60 days of talks deliver, and what the answer means for the market.
The targets are tough nuts to crack; Iran’s nuclear programme, its missiles, its regional proxies. These are the same questions that have resisted resolution for the 47 years since the Iranian Revolution. Compressing them into a two-month window does not make them easier; it just attaches a deadline. Safe & free passage through Hormuz, meanwhile, is guaranteed for 60 days only.
Markets have decided this will work anyway. European gas has handed back most of the war-and-Hormuz risk premium, even though physical flows through the Strait are still a trickle and the supply picture is barely improved. Diplomatically, everything has changed; on the water, almost nothing has. Sentiment has sprinted ahead of reality, and that gap is the story.
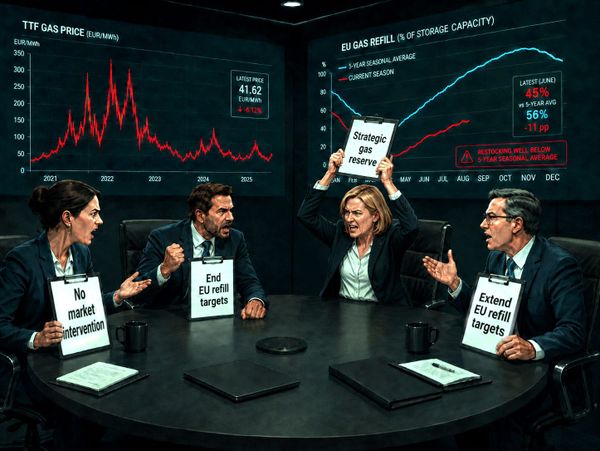
The curve is contorting
In EU gas markets, the repricing has bent the forward curve into shapes that do not quite add up: the front-month signal points one way while the contracts that actually move cargoes point the other. Read the right contract and the picture is far more coherent than the headline spread suggests. Measuring that gap, precisely, is what this week’s Chart Deck is built to do.
What the deck shows
Six proprietary models anchor this week’s 121-slide edition, all circling one core question: how far has sentiment run ahead of the fundamentals?
- TTF Sentiment Tracker: how investment funds and commercials are positioned, and how hard the funds have leaned into the sell-off.
- TTF Risk Model: what our composite score reads now that bearish positioning is overpowering tight physical fundamentals.
- TTF Value-at-Risk: how much risk budget the funds are burning to hold the line, and what last week’s volatility did to it.
- EU gas storage refill projections: our 1 November fill-level scenarios, and why they leave winter risk looking under-priced.
- FOB netbacks: why the TTF sell-off has, counter-intuitively, improved the economics of pulling LNG cargoes to Europe.
- Hormuz Closure LNG Supply Impact Model: model the MoU’s own timelines, from an ambitious 80%-in-30-days reopening to slower and more realistic paths, and what each does to global supply out to 2029.
💥 Article stats: 1,000 words, 121 slides (PDF / PPSX download)

Not yet a subscriber? The markets have moved on from Hormuz. The ships have not. Subscribe to Energy Flux for the full 120-slide Chart Deck and the analysis below: the positioning data, the storage maths, and why the headline gas spread is misleading.

Member discussion: Priced for peace?
Read what members are saying. Subscribe to join the conversation.