Total eclipse of the market
European gas is trading in the fleeting umbra of an eerie calm. Eclipses always end — and this one ends in a searing winter burn

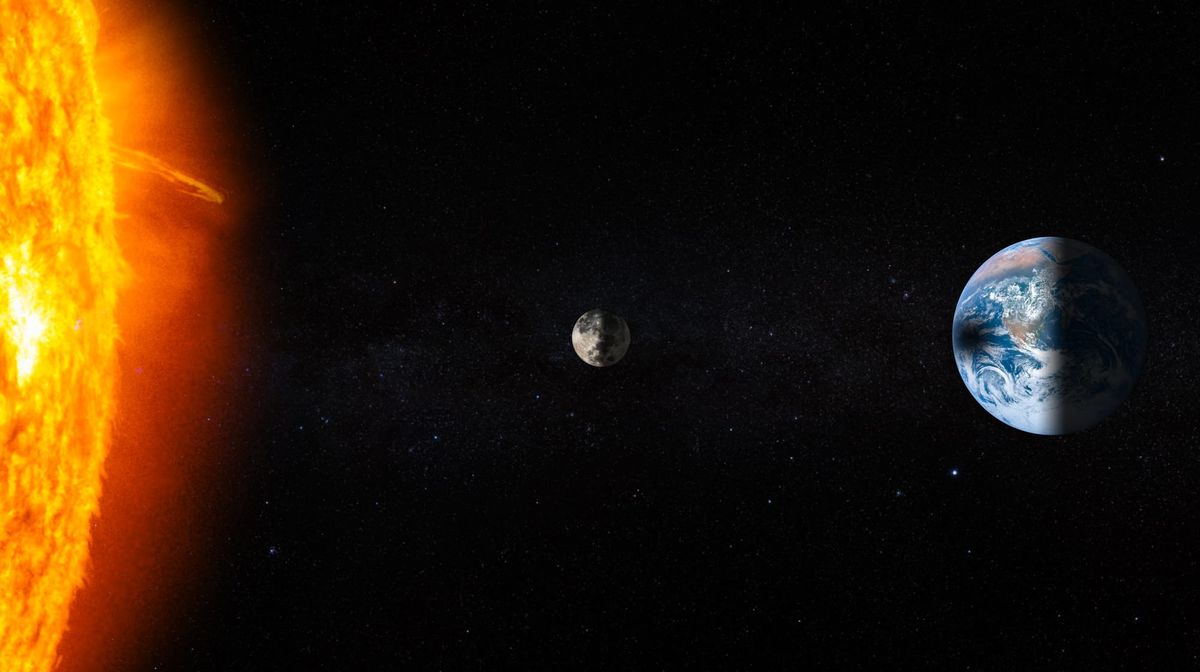
During a solar eclipse, the ‘dark’ side of the moon is entirely bathed in sunlight. At the same time, the Earth-facing side of the moon becomes silhouetted. An eclipse is thus a brief inversion of normality: illuminated areas go dark, and perennial shadow is bathed in pure light. All of this is a function of syzygy: the perfect alignment of three celestial bodies.
In a sense, the European energy market feels like it has been caught in a months-long eclipse since the closure of the Strait of Hormuz in March. An eerie calm descended after the shock-and-awe of the initial US-Israeli offensive on Iran, as three overbearing powers conspired to keep market sentiment from boiling over.
The syzygy of calibrated political messaging, optimism bias among market participants, and LNG demand deferral kept prices artificially cool under the fleeting umbra of the Hormuz eclipse. While everybody knows this surreal moment of calm totality cannot last, they are nonetheless captivated by it.
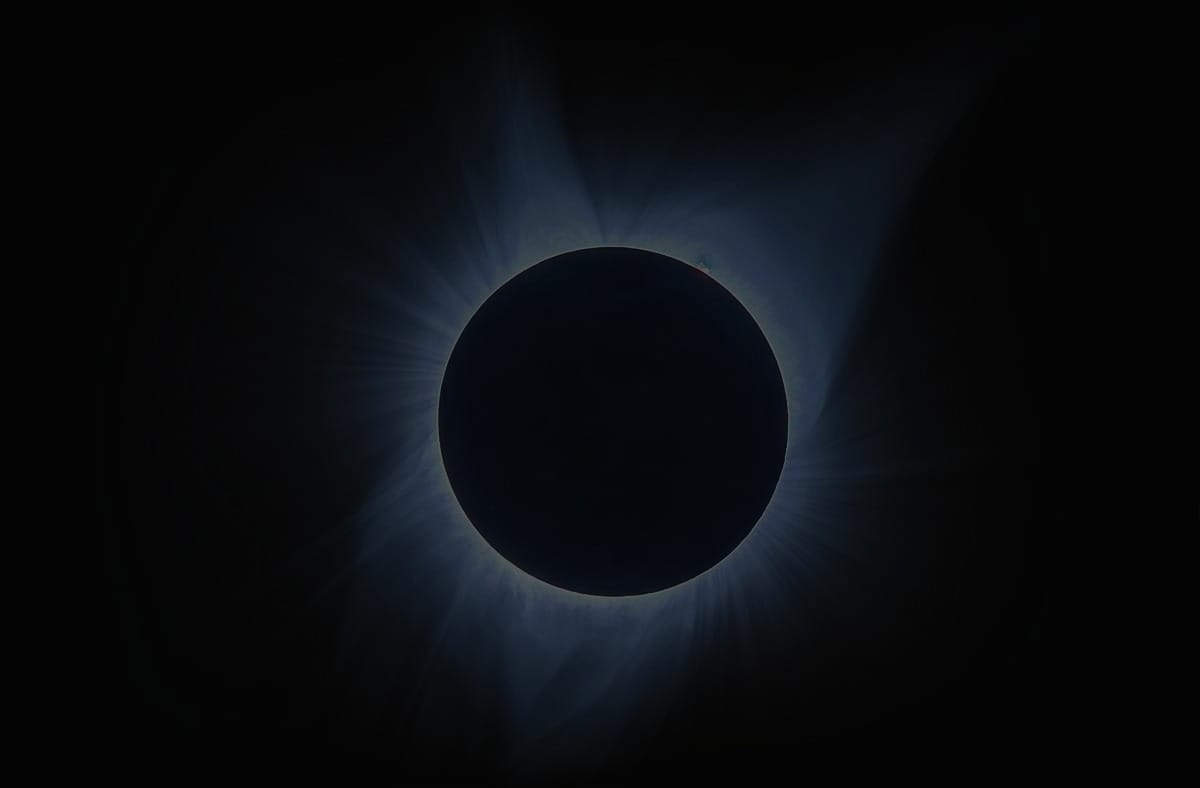
The analogy extends to Baily’s beads, the string of light spots that appear around the Moon’s edge when the moment of totality passes. As the end of summer looms into view, irrefutable evidence of the winter disaster that’s creeping up on European energy markets starts to glimmer.
The yawning EU gas storage deficit, collapse in European LNG imports, and rapidly expiring summer injection season left to address them both, are all glinting from behind the Hormuz eclipse of market rationality. As the interminable European summer heatwave drags on, the beads of data will grow in intensity, becoming impossible to ignore.
Paid subscribers:
Download this week’s Chart Deck
Eventually the warning signs will bleed into each other and onlookers will be exposed to the full searing glare of reality: the thinnest of gas buffers going into a winter hamstrung by perennially constrained LNG supply, an extended Norwegian pipeline outage at Ormen Lange, and Alpine hydro reservoirs depleted by a months-long heat dome that sent more than a million acres of continental forests up in flames.
With Dutch TTF trading around €61/MWh, some of the ballooning winter risk has been priced into the forward curve on Dutch TTF, but not all of it. This week’s subscriber-only Chart Deck highlights where the mispricing is most pronounced, how the economics of global LNG trade are shifting, and how investment funds are reacting.
In this week’s subscriber-only Chart Deck:
- Why our TTF Risk Model just did something it has never done before — and why funds are selling into the anomaly
- The storage scenario nobody wants to price: where EU gas inventories actually land on 1 November if injection momentum holds
- The volatility gift: our Value-at-Risk model that explains how funds are executing a winning exit from TTF length
- The painful Hormuz hangover: why the most mispriced contracts on the TTF curve are not this winter
- Freight rates crash and cargoes on the water go cheap: what the spot-curve disconnect says about the crunch ahead
💥 Article stats: 2,000 words, 8-min read time, 128-slide deck download

Upgrade to Premium to unlock the downloadable +100-slide Chart Deck and subscriber-only market commentary below.
Credit card not an option? Need group access, or a corporate account?
We offer flexible subscription options to suit all needs

Member discussion: Total eclipse of the market
Read what members are saying. Subscribe to join the conversation.