

Data models

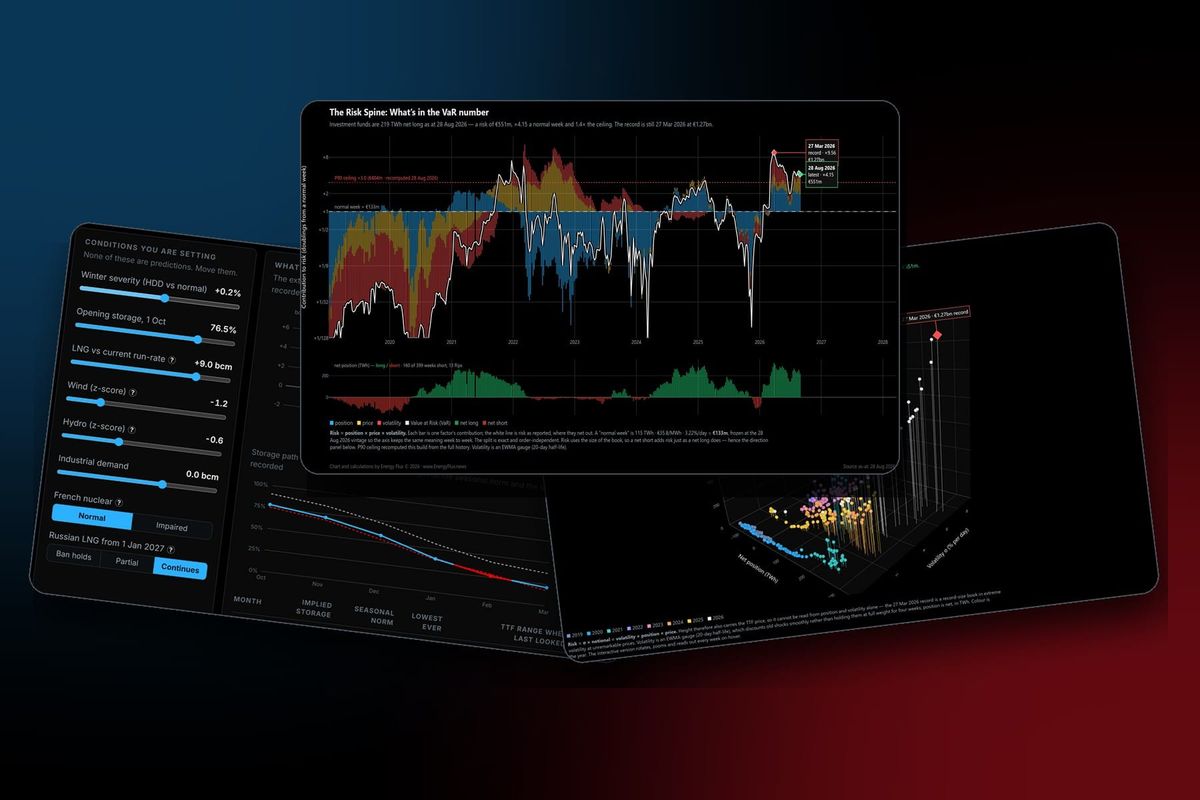
Interactive data models built by Energy Flux for paid subscribers: live tools that put proprietary analysis in readers' hands. Set the conditions and see what the historical data implies, or explore a decade of positioning and price dynamics in 3D. Models built from weekly data β€” the TTF Risk Spine and Risk Cube β€” are rebuilt after every ICE Endex Commitments of Traders print. Seasonal models, like the EU Gas Winter Stress Tester, are recalibrated for each season. Explore them below πŸ‘‡

Interactive data models · paid subscribers

Hover or tap to open. Clips are short screen recordings of each model in use.

Updated weekly

Risk Spine

What’s in the VaR number

Investment funds’ TTF risk, split weekly into the three things that move it: position, price and volatility. Navigate a decade of risk data.

Open the model →
Updated weekly

Risk Cube

Price × volatility × position = VaR

Every weekly fund position since 2019 in three dimensions, with the euro risk it carried as height. Rotate, zoom, isolate a year.

Open the model →
Winter 2026-27

EU Gas Winter Stress Tester

Set the winter, read the storage path

How bad could winter get? Set weather, LNG, wind, hydro and demand; the model reports what 2014–2026 data implies.

Open the model →
Scenario engine

Hormuz Closure Model

LNG supply scenarios, month by month

Set reopening timelines, flow restoration and Qatar’s recovery against a global LNG project tracker, and read the supply impact.

Open the model →