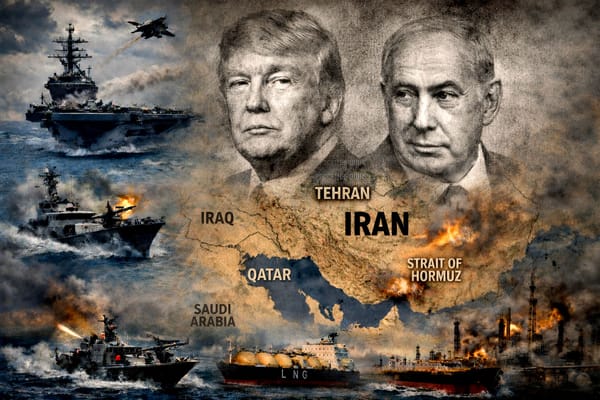
War in Iran convulses energy markets
Hormuz closure and Qatar LNG shut-in trigger extreme volatility in gas, LNG and freight charter rates. The outlook is dire, especially for Europe, but not unremittingly so.

It has been a week of fire-hose news flow. Energy markets are shuddering under the immensity of the loss of one-fifth of global oil and gas supply. Potentially catastrophic second- and third-order effects are rippling menacingly through global supply chains and financial systems.
Barely a week into the abrupt outbreak of war in Iran, the temporary closure of the Strait of Hormuz – a vital artery in Middle Eastern hydrocarbon outflows – has the world economy braced for another hyper-inflationary energy supply shock.
Dizzying questions abound. Can further escalation be avoided? Is this 2022 all over again? How long might this untenable situation endure?
The yardstick for gauging seismic energy supply shocks is Russia’s full invasion of Ukraine. The loss of more than 100 billion cubic metres (Bcm) of Russia pipeline gas propelled European hub prices as high as €340 per MWh in August 2022.
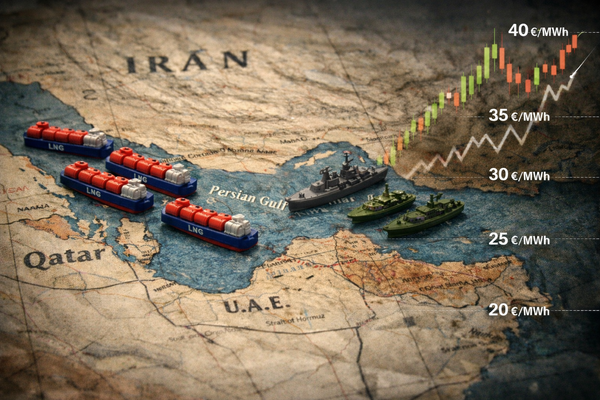
We are a still long way from those extremes. Dutch TTF has achieved an uneasy equilibrium around the €50/MWh mark, having spiked +70% at the start of this week. Whether this is the high watermark of 2026 belligerence pricing or the mere foothills of a much greater crisis depends entirely on one factor: the ultimate duration of Hormuz transit disruptions.
Excruciating uncertainty
Against a backdrop of indiscriminate destruction and horrific human tragedy, attempts to restore safe passage are underway. The Trump administration is seeking to underwrite war risk premiums that were cancelled when conflict broke out; China is reportedly seeking to broker a backroom deal with Tehran to restore oil and LNG outflows.
Whether these initiatives bear fruit remains to be seen. In the meantime, drones, mines and missiles pose a material threat to the physical integrity of commercial tankers and vessels. Passage in these conditions remains perilous, regardless of sovereign guarantees of financial and physical protection.
QatarEnergy, which declared force majeure on LNG supplies after drones damaged infrastructure, anticipates resumption of exports within four weeks. Technically this is achievable, according to experts.
But fixing damaged liquefaction facilities is only part of the challenge at hand. With thousands of cheap Shahed drones at its disposal, Iran has the capability to disrupt Hormuz tanker traffic for months. The Islamist regime has proven resilient to the loss of its ayatollah and is intent upon exploiting the benefits, however slim, of asymmetrical warfare against a vastly superior military adversary.
Drama in the data
Against this deeply uncertain backdrop, natural gas and LNG markets are proving remarkably sanguine. This special edition of the subscriber-only Energy Flux Chart Deck breaks it all down in the usual forensic detail: exchange data, fund positioning, regional LNG flows, proprietary analysis of US LNG netbacks, arbitrage economics, and rolling assessment of Asian spot versus oil indexed LNG.
The headlines are screaming about extreme price volatility. Undeniably (and predictably), benchmark prices have rallied to multi-year highs (slides 9 & 10). But that's not only part of the story.
The biggest contortions occurred in the LNG freight market, which immediately priced in stranded tonnage and the need to ship Atlantic cargoes longer distances to Asian markets deprived of Qatari LNG. Spot charter rates registered successive day-on-day record increases to peak at a staggering $300,000 per day (slide 43).
This could work to Europe’s advantage; while the US-Asia arbitrage is marginally open for immediate shipments in April and May, the arb window is still priced as closed for the remainder of the year (slides 67-69).
The stuff of logistical nightmares
This is particularly true for US LNG transiting the Cape of Good Hope, the southernmost tip of Africa, to reach Asian markets. Exorbitant freight rates render this 80-day round-trip voyage uneconomic compared to delivering cargoes into much closer European terminals (slide 44).
That is not to say that Atlantic basin cargoes are staying put. On the contrary, a spate of diversions is underway as numerous traders seek to capitalise on heightened spot demand in Asia, the primary destination for Qatari LNG that is temporarily shut-in (slides 76-80). Perhaps the calculus is that netbacks will have increased substantially by the time vessels complete the 30-day, 15,000-nautical mile journey. Or maybe these players treat shipping as a sunk cost.
Amidst this confusing outlook, the unprecedented sinking of a sanctioned Russian LNG tanker in the Mediterranean, purportedly by a Ukrainian drone, has added a fresh layer of logistical complexity. Several vessels linked with Russian LNG trade are diverting away from the Mediterranean to avoid suffering a similar fate (slides 72-75). Longer voyages and reduced capacity threaten to curtail shipping capacity from the heavily sanctioned Arctic LNG 2 plant at an inopportune moment.
Reassessing the refill challenge
Much has been said about the immense challenge of refilling depleted European gas storage facilities while competing with gas-starved Asian markets for flexible LNG cargoes. Certainly, the resurgence of inverse summer-winter spreads and extreme backwardation renders storage procurement profoundly loss-making (slides 14-15).
Still, the outlook is not unremittingly dire. The rate of European storage withdrawals has dropped to unseasonal lows, reducing somewhat the refill burden that awaits (slides 45-48). With milder temperatures beckoning and indications that the US and China have a shared interest in resuming Hormuz transits, Europe may find it can weather the worst of the storm with steady LNG inflows and attack the bulk of the refilling challenge in calmer market conditions.
Impossible cost of replacement
Markets are assuming that unmet Asian demand will spill over into the spot market. But the cost of replacing lost Qatari volumes will be immense. At current JKM prices, oil indexed LNG is up to $10/MMBtu cheaper than spot. At a 10% slope to JCC oil, the cost difference for a single cargo is more than $45 million (slides 50-55).
Replacing lost Qatari volumes in the spot market will thus be painful – perhaps prohibitively so for many price-sensitive Asian buyers. Is there any end-use application with margins that justify a $45 million markup? Cheaper alternatives must be sought, and if not available, the temptation will be to go without. Demand destruction must play a big role in balancing the market, especially if Hormuz remains closed for several months.
Take solace in the long view
Looking further ahead, the picture is less catastrophic. The Dutch TTF forward curve gapped up for all maturities as far out as Q1 2027, but long-dated contracts for all subsequent delivery months are still trading at pre-war price levels (slides 16-18). Essentially, the long-view is unchanged: gas markets are still heading towards a structurally looser supply panorama. It might just take a bit longer to get there.
The economic shock of Middle East regional war is only just starting to be felt, and the worst effects will compound and metastasise over the coming months. But this too shall pass. The enduring human urge for peace and stability always outlasts the fleeting impulses of aggression, greed and hubris that drive conflict.
The path to a stable energy future has undeniably become more treacherous, narrow, and expensive. The complexity and chaos of unravelling alliances and deep geopolitical turmoil is not to be taken lightly.
At the same time, there is nothing remotely sustainable about all this. When history books are written about the events of 2026, they might describe a fate far less cataclysmic than the one that today, in the midst of war, might seem inevitable.
Seb Kennedy | Energy Flux | 6 March 2026
See beyond the fog of war. Get instant access to this week’s 90-slide Chart Deck and see what the positioning, flows and curves actually say — not what the market is shouting.
💥 DOWNLOAD: 90+ slides in .ppsx and .pdf format 👇

Member discussion: War in Iran convulses energy markets
Read what members are saying. Subscribe to join the conversation.