Whiplash!
TTF turns on a dime, but is risk being priced properly? | EU LNG Chart Deck: 20 June 2025

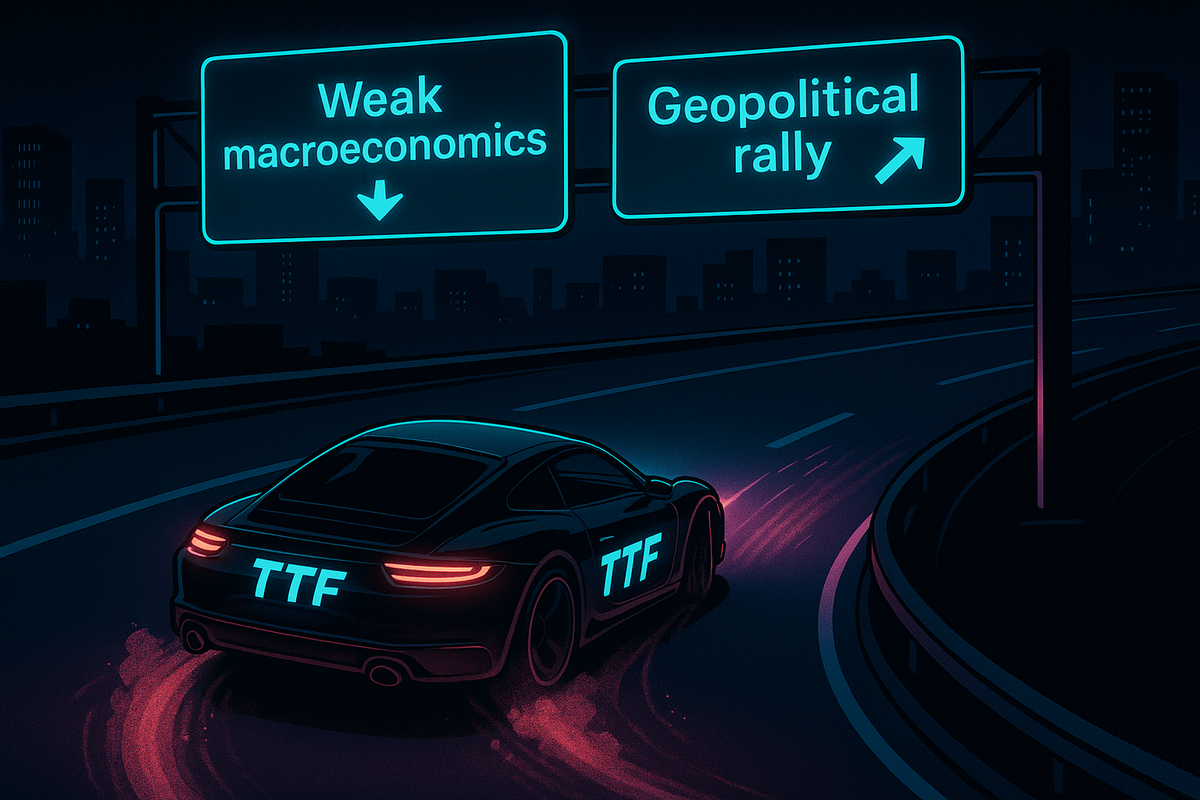
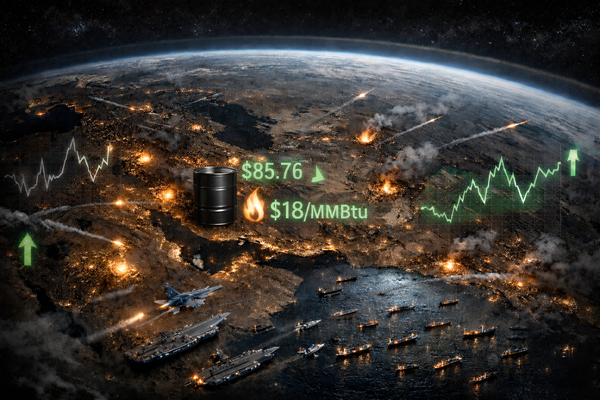
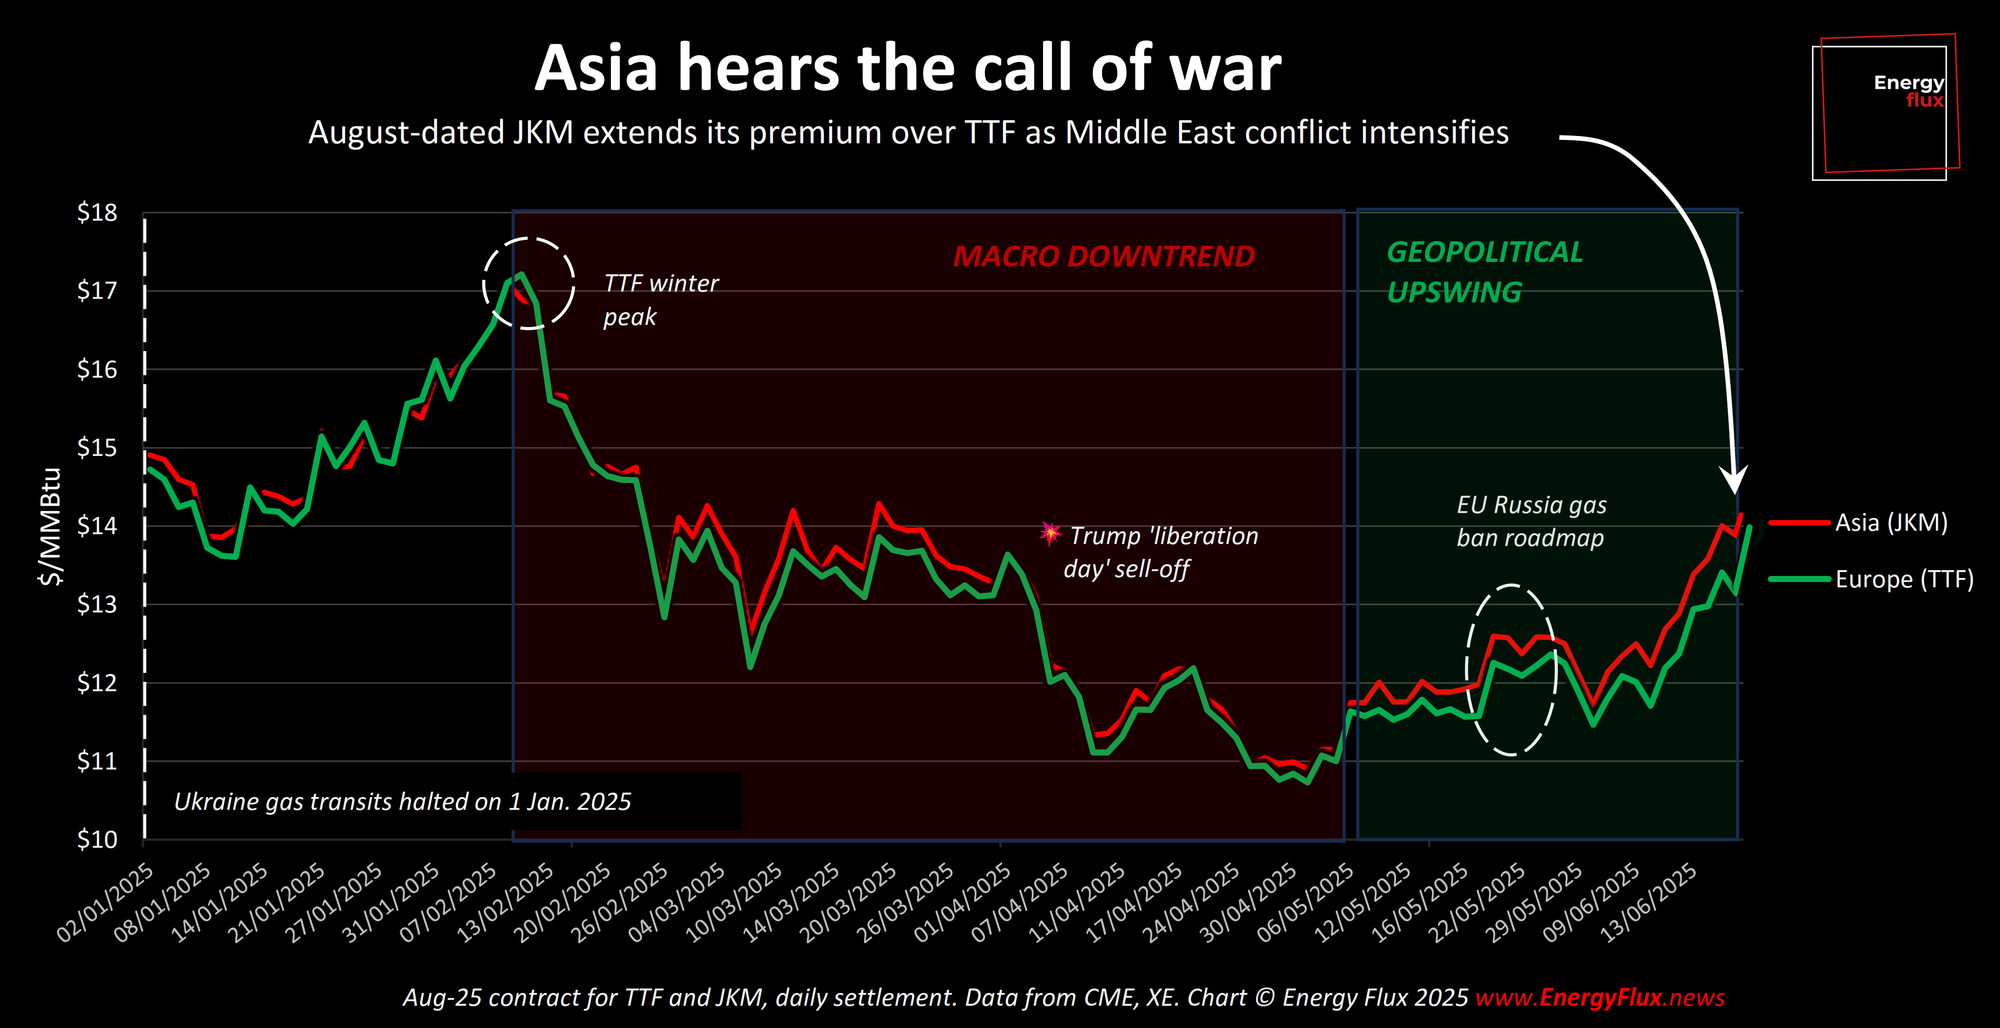
As the Israel-Iran conflict intensifies, geopolitics is firmly back in the driving seat of natural gas markets. The Middle East crisis has relegated macroeconomic concerns to the back seat.
The stakes are high and visibility is low. Iran might capitulate tomorrow, or the US might enter the fray in full force.
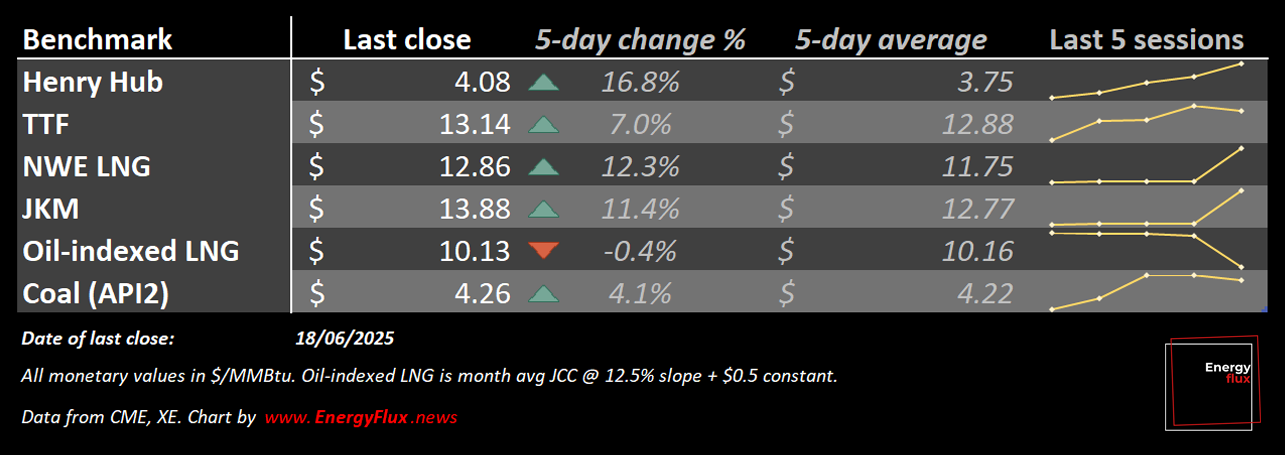
TTF has soared 20% in 10 days, reflecting the rising risk of supply-side disruptions. Despite flagging Asian demand for LNG, JKM has made similar moves to extend the Asian spot premium over Europe.
The question on everyone’s lips: are war risks fully reflected in European gas prices? This week’ EU LNG Chart Deck seeks to shed some light on this matter, with the aid of a new data model.
The TTF risk model quantifies the deviation in speculative sentiment and curve slopes versus historical norms, to gauge the potential for over- or under-pricing of risk in today’s febrile market conditions.
Level up your market insight. Subscribe to Energy Flux and support fiercely independent market analysis – now with a free trial
This post also runs the rule over:
📈 Shifting TTF curve structure and calendar spreads
🌎 Inter-basin arbitrage signals for global LNG trade flows
🦥 Investment funds’ surprisingly cautious repositioning
❓ Whether this geopolitical shock marks a structural departure from the prevailing price regime
Without further ado, let’s get stuck in.
Article stats: 1,800 words, 11-min reading time, 11 charts & graphs

Member discussion: Whiplash!
Read what members are saying. Subscribe to join the conversation.