Deciphering the Hormuz narrative war
Washington says Iran has lost control of Hormuz. Iran says it struck tankers on its blacklist. More ships are moving, but on whose terms?

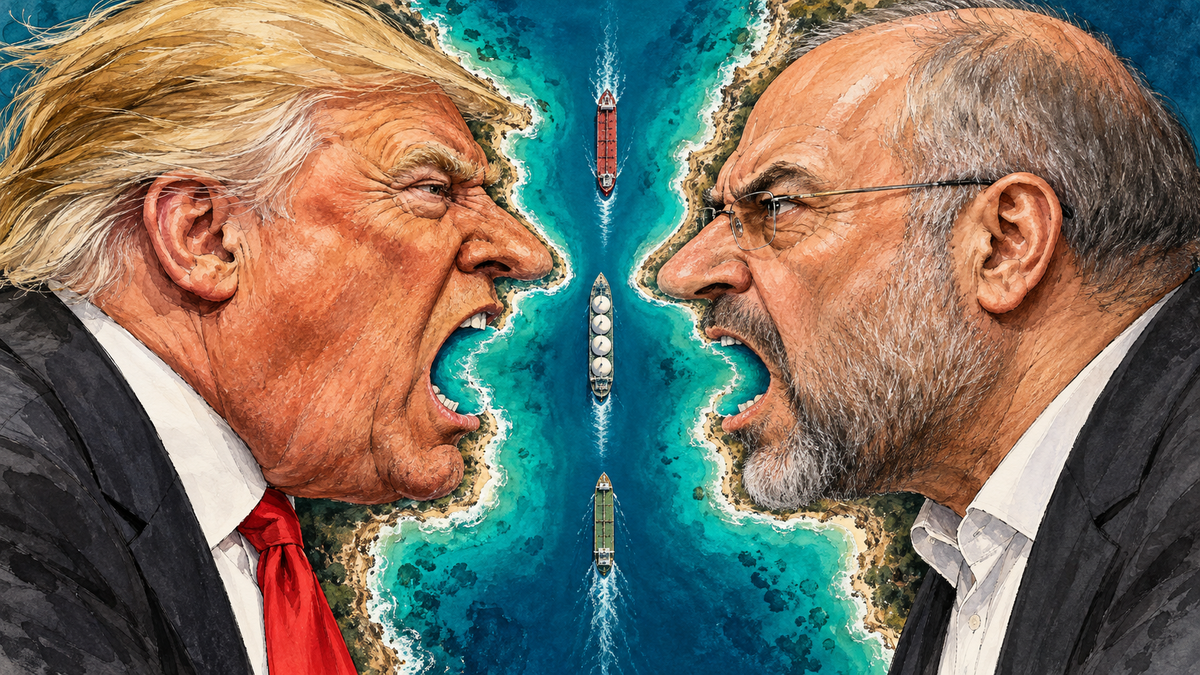
Late on Tuesday, Donald Trump posted that “Iran Has Lost Control of the Strait”, capping a fortnight of US claims that the blockade works and the strait is open. Many commentators and analysts were taken in by this.
The shipping record disagrees. UKMTO disclosed four tankers struck on 28–29 September and a fifth set on fire on 1 October.
Then Iran’s strait authority said the three tankers hit on 29 September were on its list of non-compliant vessels. That is not the language of a state that has lost control, so much as one running a permit system.
Dutch TTF, the European gas benchmark, still ended September at €72.36/MWh, 12% below its mid-month peak, as the headlines declaring ‘flows full restored’ piled up.
A valve, not a wall
Our analysis of Kpler’s vessel-tracking data shows 17 laden LNG carriers left the Gulf in September, up from six in August but against 99 in January. Most commentary reads rising traffic as Iran losing its grip. Few consider the alternative: that Iran is letting more ships through to stop its leverage wasting away.
Every month of closure pushes buyers to engineer the strait out of their supply chains. A controlled flow keeps them invested in reopening, rewards friendly Asian buyers and shows who decides. Flows that rise at Iran’s discretion can fall at Iran’s discretion.
Our Quantum Transits model puts TTF’s implied odds of indefinite closure at 53%, from 57% a week earlier. The odds eased because prices fell in a week when more ships were struck, not fewer.
What the deck shows
Headlines and the price ticker cannot tell you who is driving the market, how much firepower is left, or what happens after the heating season. This week’s 140-slide Chart Deck tracks all three, with proprietary models built for exactly this kind of uncertainty:
- Who is driving TTF: our TTF Sentiment Tracker and Storage-Speculation Nexus show whether fund money is leading the price or riding it.
- How much risk room is left: our Value-at-Risk section measures fund risk against the level where buying has historically stalled, now on a corrected volatility series.
- Where storage exits winter: a new chart replays 15 winters from today’s fill level.
- Who wins the LNG capacity race: new charts track every IEA capacity update since June 2025, including Wednesday’s revision.
Plus the full term structure, freight, inter-basin arbitrage, Hormuz crossings and global LNG flows, and the TTF Risk Model. And as always, our Risk Spine, Risk Cube and Quantum Transits models are updated weekly.

Upgrade for the full Chart Deck and our five charts of the week: where Europe exits winter, who is winning the LNG capacity race, and the price at which funds’ risk budget fills.
Paid subscribers:
Download this week’s Chart Deck

Member discussion: Deciphering the Hormuz narrative war
Read what members are saying. Subscribe to join the conversation.