Sizing up the LNG glut (part 1)
DEEP DIVE: When will the global LNG market tip into oversupply? And what might the transition to a new pricing regime look like?

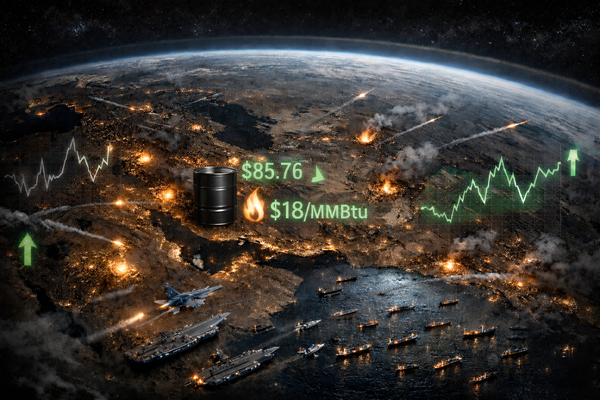
With the aftershocks from 2022 still reverberating, the liquefied natural gas market is awash with tension and uncertainty. Before much longer, it will be awash with surplus LNG too.
The United States and Qatar are racing to flood energy markets with a record 40% increase in liquefaction capacity by 2030. But when exactly will this supply wave start to loosen global balances? And when it does, how deep and long might the ensuing glut be?

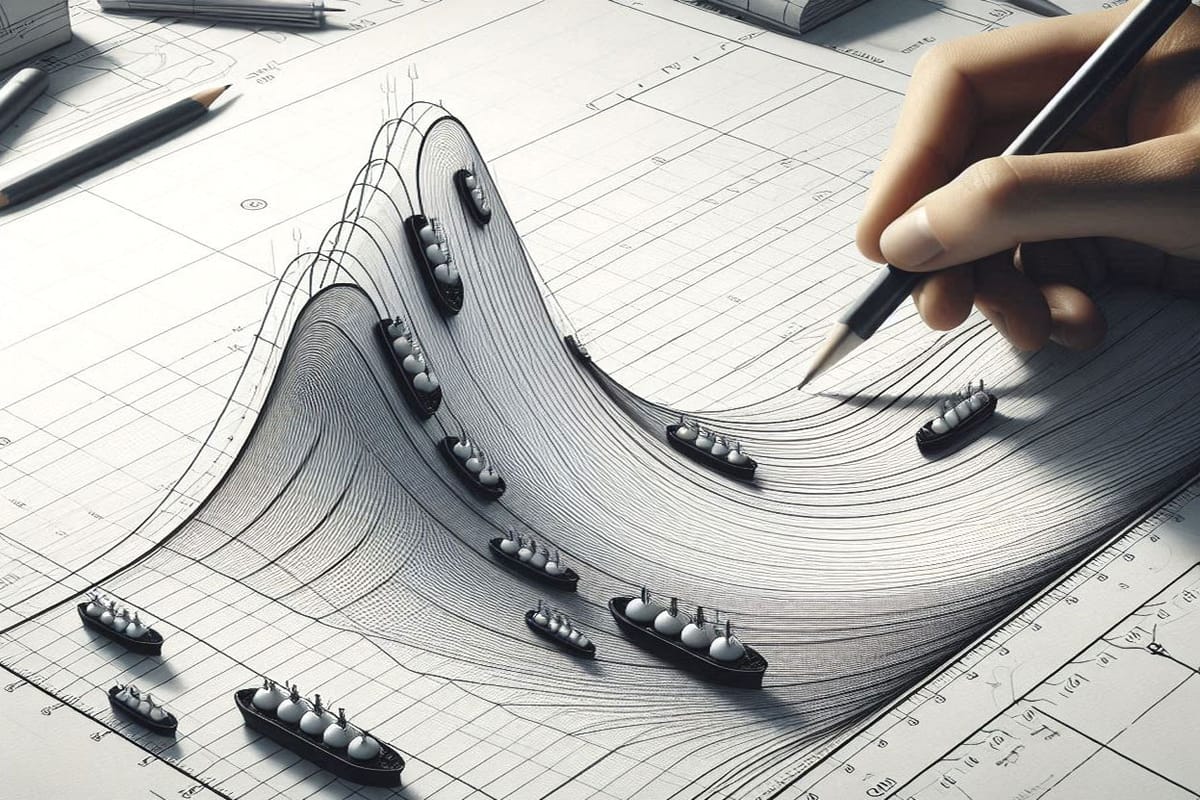
LNG tsunami
The coming supply wave is, frankly, immense.
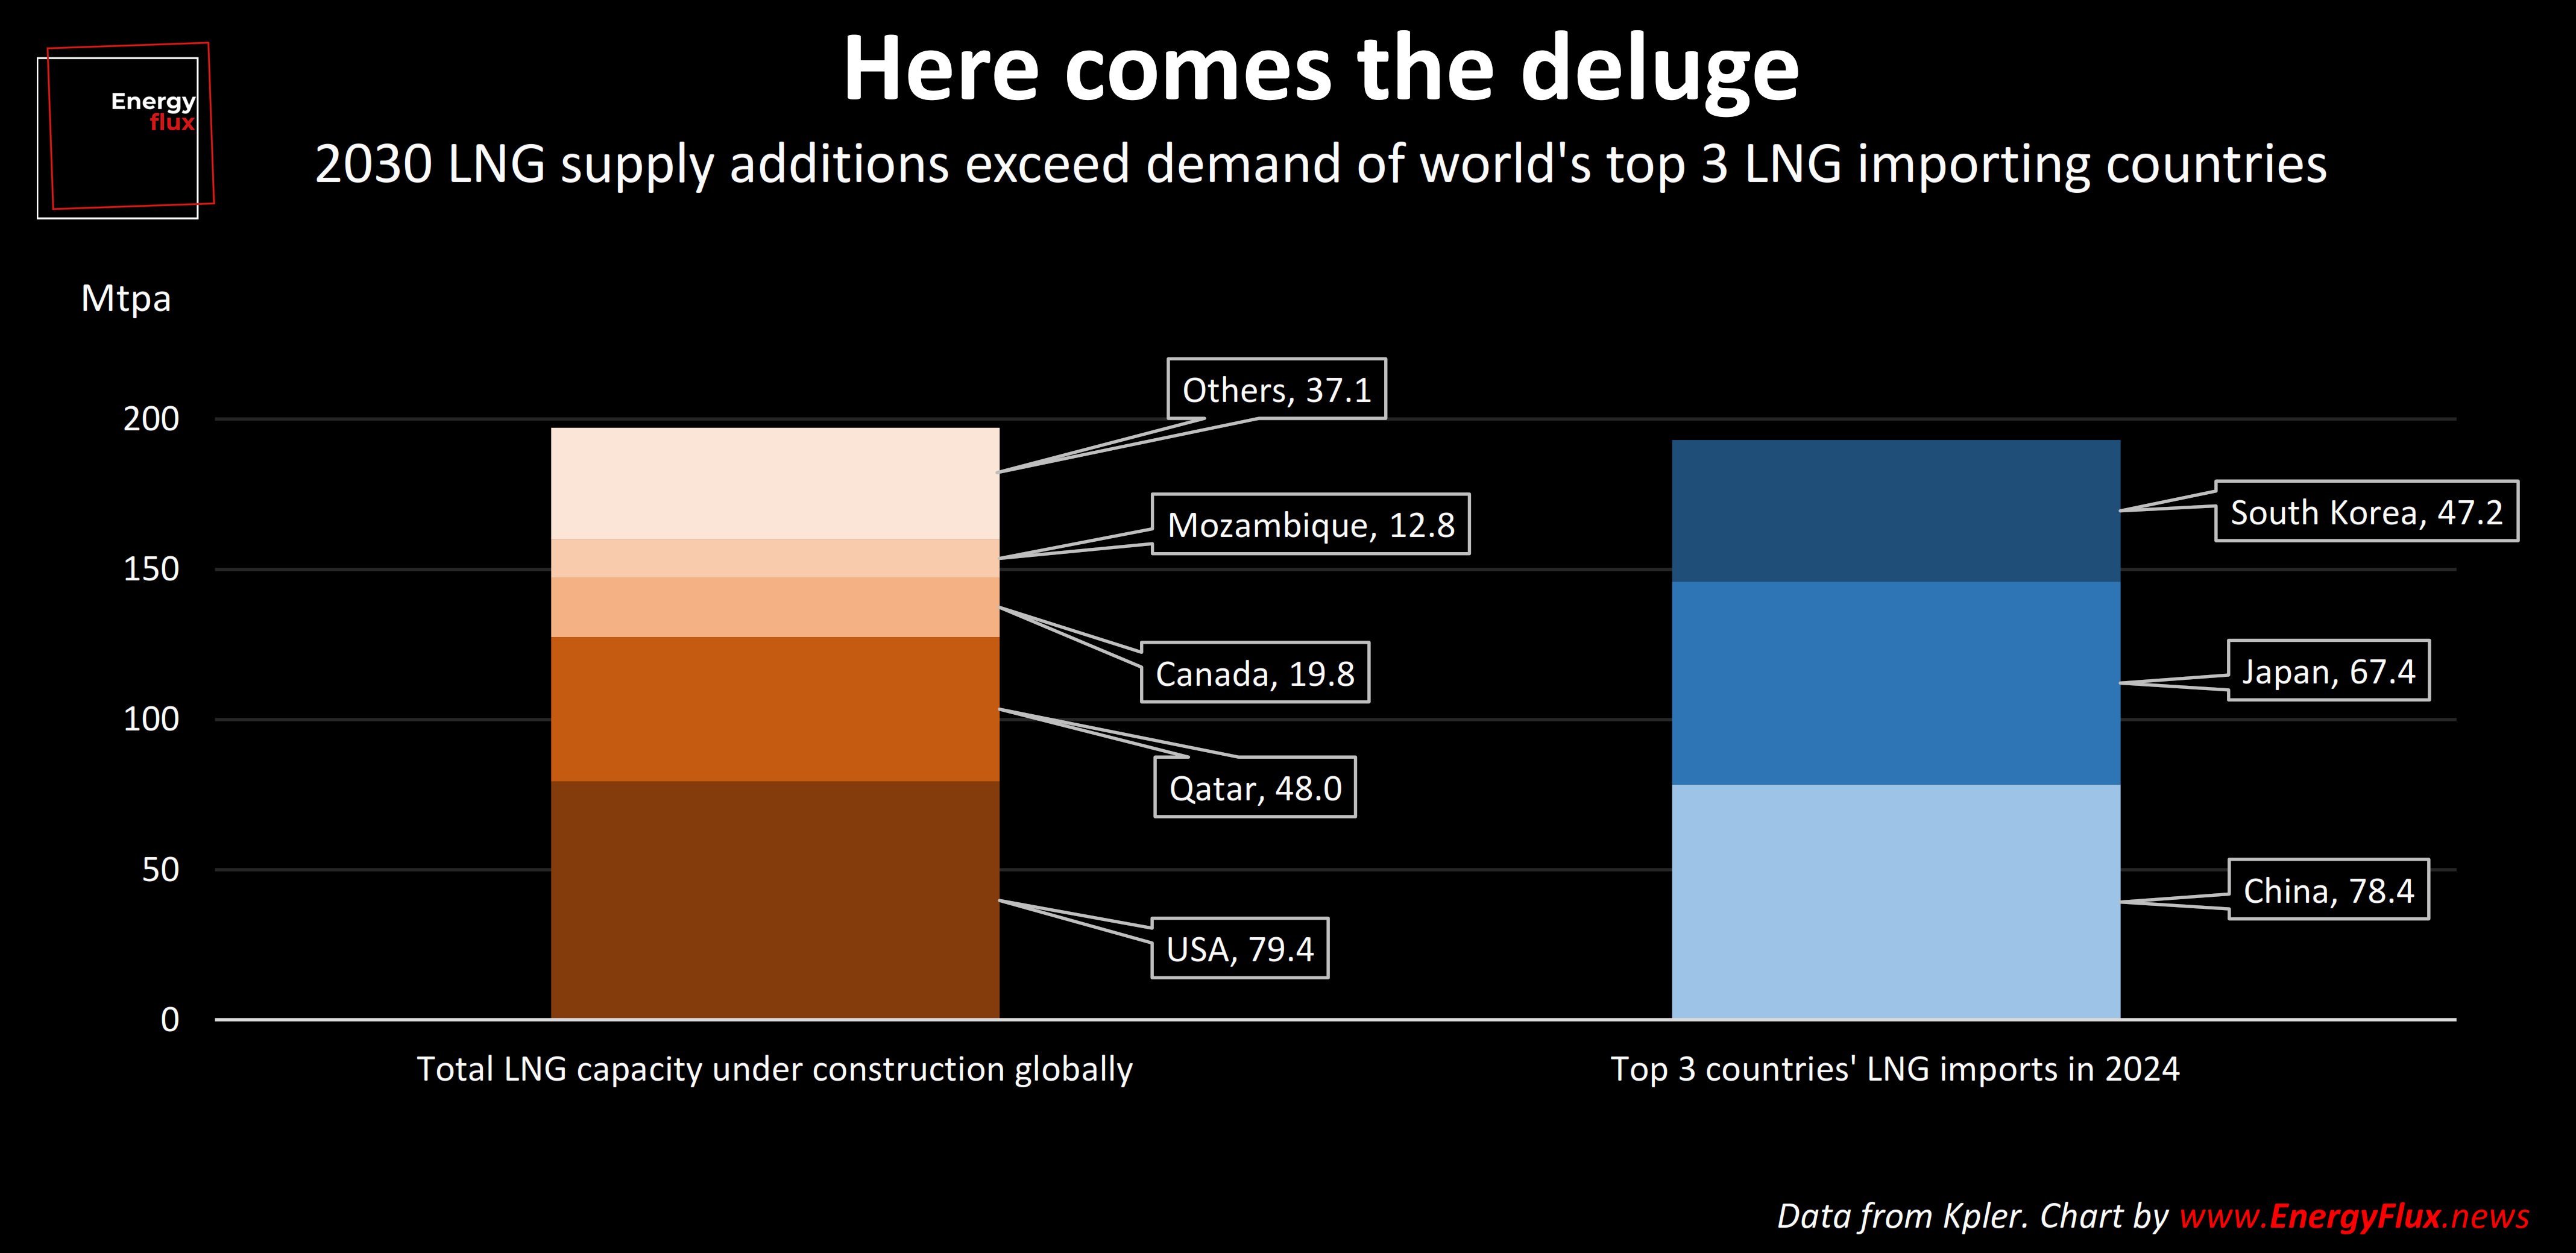
Qatar is building out 48 million tonnes per annum (mtpa) by 2028, and the US has almost 80 mtpa under construction.
Together with Mozambique, Canada and others, that’s enough to meet the annual LNG import requirements of China, Japan and South Korea combined.
The International Energy Agency, in its 2024 World Energy Outlook, said LNG supply could exceed demand by 18% in 2030 under its ‘STEPS’ (Stated Policies) scenario.
This implies a glut of 125 billion cubic metres of gas, or roughly 92 mtpa of LNG, in the space of five years.
To put that into context, 92 mtpa is comparable to the combined annual imports of China and India, meaning LNG sellers must somehow find another China-plus-India-worth of consumption to absorb the surplus they are about to dump onto the water.
To balance the market, European wholesale natural gas prices could fall by more than half in the next two years. If decarbonisation policies weigh more heavily on demand growth, the surplus — and price correction — will be that much greater.
Wishful thinking?
However, that doesn’t tell the whole story. For a start, demand might not follow the STEPS scenario.
STEPS assumes higher fossil fuel consumption than other more climate-hawkish IEA scenarios, but its projection of global energy demand growth deceleration is still somewhat aspirational compared to historic trends.
On the supply side, many LNG projects due online before 2030 are sliding to the right.
US sanctions hobbled Russia’s flagship Arctic LNG-2 project; Golden Pass LNG in Texas ran into major construction delays; and Mozambique LNG has been beset by so many security and humanitarian crises that it might never be built.
From feast to famine
Supply-demand projections from high-profile consultancies tell a very different story to the IEA WEO.
Rystad, for instance, depicts only a very brief and shallow period of oversupply in 2030, and any excess is quickly gobbled up by insatiable Asian demand growth — leaving a supply deficit by the mid-2030s under a 1.9 degree warming scenario.
Similarly, Wood Mackenzie sees a deficit emerging as early as 2030:
So, how should impartial observers parse these vastly different visions of the future? Is the LNG ‘glut’ just another narrative, an intoxicating mirage in the minds of energy-shocked Europeans?
Could the market really lurch into another global LNG ‘drought’ in the early 2030s — and if so, might this even create the conditions for a new LNG supercycle next decade?
Perhaps both of these visions are misleading. This new multi-part Deep Dive takes a wide-angle lens to gauge the contours of the LNG ‘glut’.
Part one (this post) reviews previous LNG supercycles to put the current market phase into historic context.
—> This perspective offers a new way of thinking about how the shift to a new global gas price regime could unfold.
Part two (available here) identifies the main drivers of supply and demand growth and how these intersect with cost and price curves.
—> This analysis is key to reconciling conflicting perspectives of the duration and depth of any surplus.
The series is informed by conversations with numerous experts and analysts on:
- policy and commercial trends driving fuel choices in key LNG demand regions
- the interaction between structural price movements and demand growth
- the cost of new LNG supply versus affordability in target markets
If you’re curious about the macro-outlook for LNG in a fast-changing energy world, this post is for you. Subscribe now for full access.
Article stats: 2,500 words, 12-min reading time, 11 charts and graphs
What is a supercycle, and are we in one now?
To understand the coming ‘glut’, we must first understand the cyclical nature of the LNG industry and how we got where we are.

Member discussion: Sizing up the LNG glut (part 1)
Read what members are saying. Subscribe to join the conversation.