TTF forensics: a war premium on a hair trigger
Dutch TTF fell from €104 to €84 in five days either side of the seismic US midterm elections. Examine the events that triggered the selloff in our new interactive data model


The European gas price is convulsing as if every geopolitical headline is a high-voltage electric shock. Dutch TTF, the regional benchmark, took a month to grind its way up from below €70 into triple digits only to shed nearly one-fifth of its value in three wild trading sessions either side of the US midterms.
On Friday 30 October, the December TTF contract settled at €103.94/MWh, the highest front-month settlement since December 2022. On Wednesday evening, the day after the US midterm vote, it traded as low as €84/MWh before rebounding back to €90 at the time of writing.
Big swings are becoming so commonplace that they often get a one-line explanation after the fact. I wanted to visualise the triggers as they unfolded, so I rebuilt the week minute by minute.
The result is an interactive forensic timeline: the biggest trades in the December contract, plotted against Brent and the main news events from Tehran, Doha, Washington and the North Sea, each timed in CET and linked to its source.
Select an event and the chart shows where the price was when the news landed, and where it went from there.
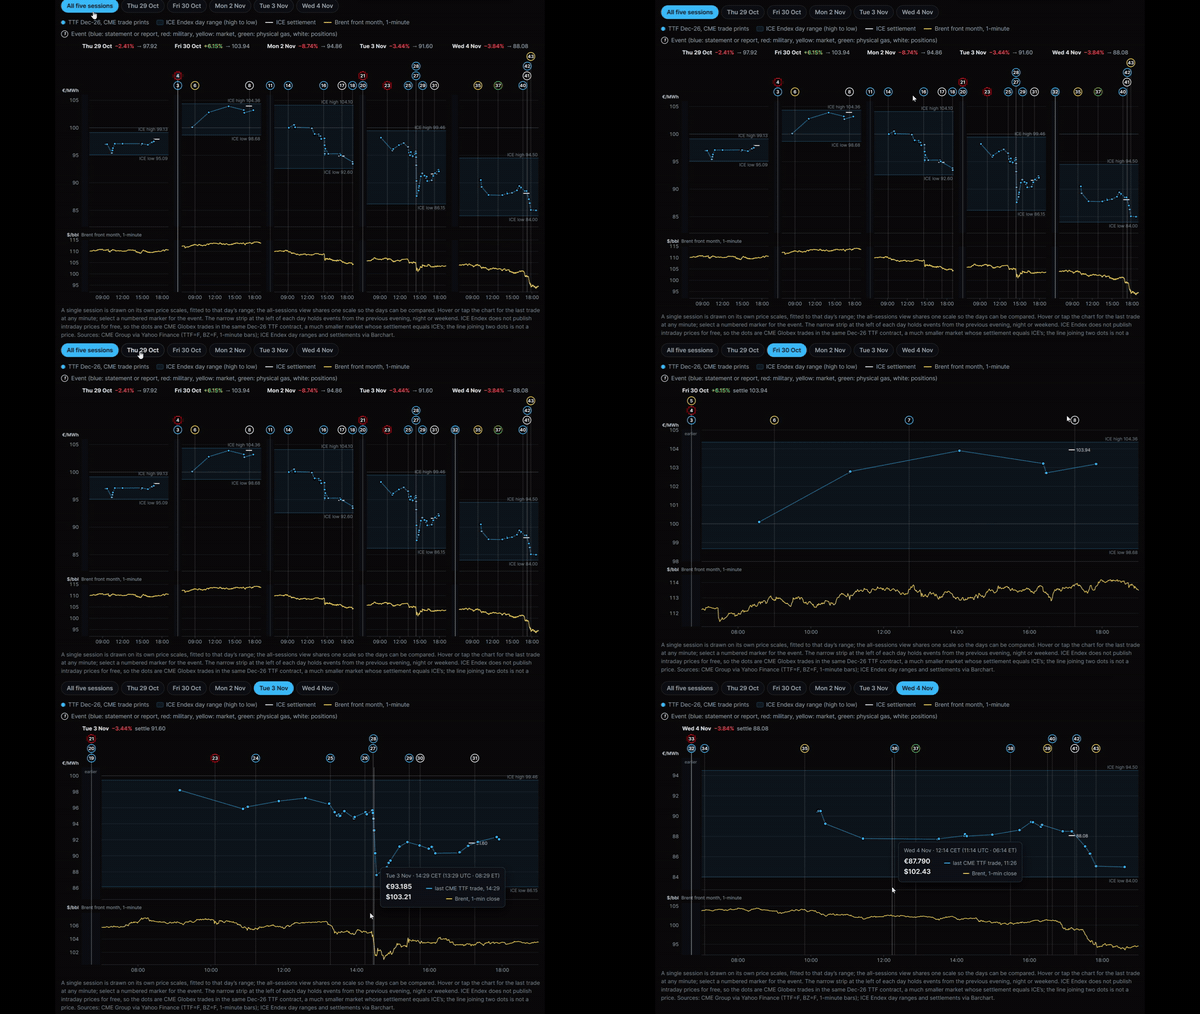
The sharpest breaks came in the same minutes as falls in Brent, and within minutes of diplomacy headlines: on Tuesday afternoon, the Dec-26 contract lost €8.40 in seven minutes.
On Wednesday, vice-president JD Vance’s X post saying “the reason we lost is the war” fuelled a fresh selloff that carried on post-settlement: another €3 by 17:50, in step with a 4.8% drop in Brent while Senate Democratic leader Chuck Schumer was saying live on CNBC that the war “must end”.
As is often the case, the physical news points the other way: an electrical fire on Equinor’s Visund offshore production platform threatening near-term supply; colder weather forecasts driving heating demand; and EU storage 73.8% full, 16 points below the 2021–25 average for the date and the lowest for the date since GIE’s records began in 2011, exposing Europe’s scant buffers so early in the heating season.
The interactive model highlights the exact moments when bearish geopolitical drama eclipsed the slow-burn bullish realities stalking the market.
Inside the timeline:
- The tape. The main TTF trades in CME’s Dec-26 TTF contract against Brent, plotted minute by minute, with the events pinned to the chart. Did gas lead oil, or follow the news?
- The curve. Friday’s jump and the subsequent three sessions of falls plotted across 25 contract months, Dec-26 to Dec-28. Turns out, the winter strip did not take the biggest hit in percentage terms.
- The positions. Open interest contract by contract, ICE’s weekly Commitments of Traders and our cost-basis read on investment funds’ book. Was this a stop-loss cascade?
- In context. Monday’s 8.7% fall and the three-session drop, ranked against every session since October 2017. How rare was it?
October’s rally, from €69.81 on 29 September, took a month to build. By Wednesday’s settlement, three sessions had reversed nearly half of it, on headlines rather than molecules.
What built it has not gone away: the strike threat stands, Qatari LNG through Hormuz ran at a fifth to a third of pre-war levels in October, and EU storage is the lowest for the time of year in GIE’s records. A hair trigger works both ways.
The charts are interactive, so they open on the web, not in email. Configured for most desktop and mobile phone browsers.
I created the model initially for internal use, mostly to help me understand the chronology of recent events as I compile this week’s Chart Deck. Since it helped me organise my thoughts, I thought it might help subscribers navigate these crazy markets too.
The weekly downloadable Chart Deck is ready and will be published first thing on Friday morning (UK time), alongside my take on this week’s seismic political events.
There is a lot to say about where the midterms leave this US administration and its foreign policy. I resisted the temptation to jump in with a Hot Take in order to take time to digest the result, to weigh up the big price moves on TTF and JKM, and to examine how the Energy Flux suite of data models responded to the latest bout of volatility.
Look out for that in the next newsletter, coming very soon...
–Seb

Member discussion: TTF forensics: a war premium on a hair trigger
Read what members are saying. Subscribe to join the conversation.