US LNG’s nine-figure windfall
As TTF touches €100 per MWh, US LNG profits in Europe swell to $100 million on every cargo. Déjà vu, 2022?


Paid subscribers:
Download this week’s Chart Deck
It is rarely a good sign when the European wholesale natural gas price becomes a mainstream news item. Dutch TTF, the EU gas benchmark, surged above €100 per megawatt-hour this week, inspiring countless comparisons to 2022 when Russia’s full invasion of Ukraine last drove prices into triple digits.
A better analogy is Q4 2021, several months before Russian tanks rolled into the Donbas. After failing to refill storage caverns adequately over summer (thanks in no small part to Gazprom’s pre-invasion market manipulation), Europe entered November with storages at 77% full and TTF trading at triple-digit multi-year highs. By Christmas it had breached €179 per MWh.
It is all eerily familiar, and there is another mind-boggling similarity: the spiralling profitability of US LNG.
In October 2021, every cargo shipped to Europe could theoretically net a profit of $100 million. This week, with TTF back at €100, illustrative US LNG profits are clocking in at a cool $105 million on every cargo, whether shipped to Europe or Asia.
I’m making an exception and putting one of the more alarming charts from this week’s subscriber-only Chart Deck above the paywall. As you can see, US LNG is deeply in the money regardless of where it is sent.
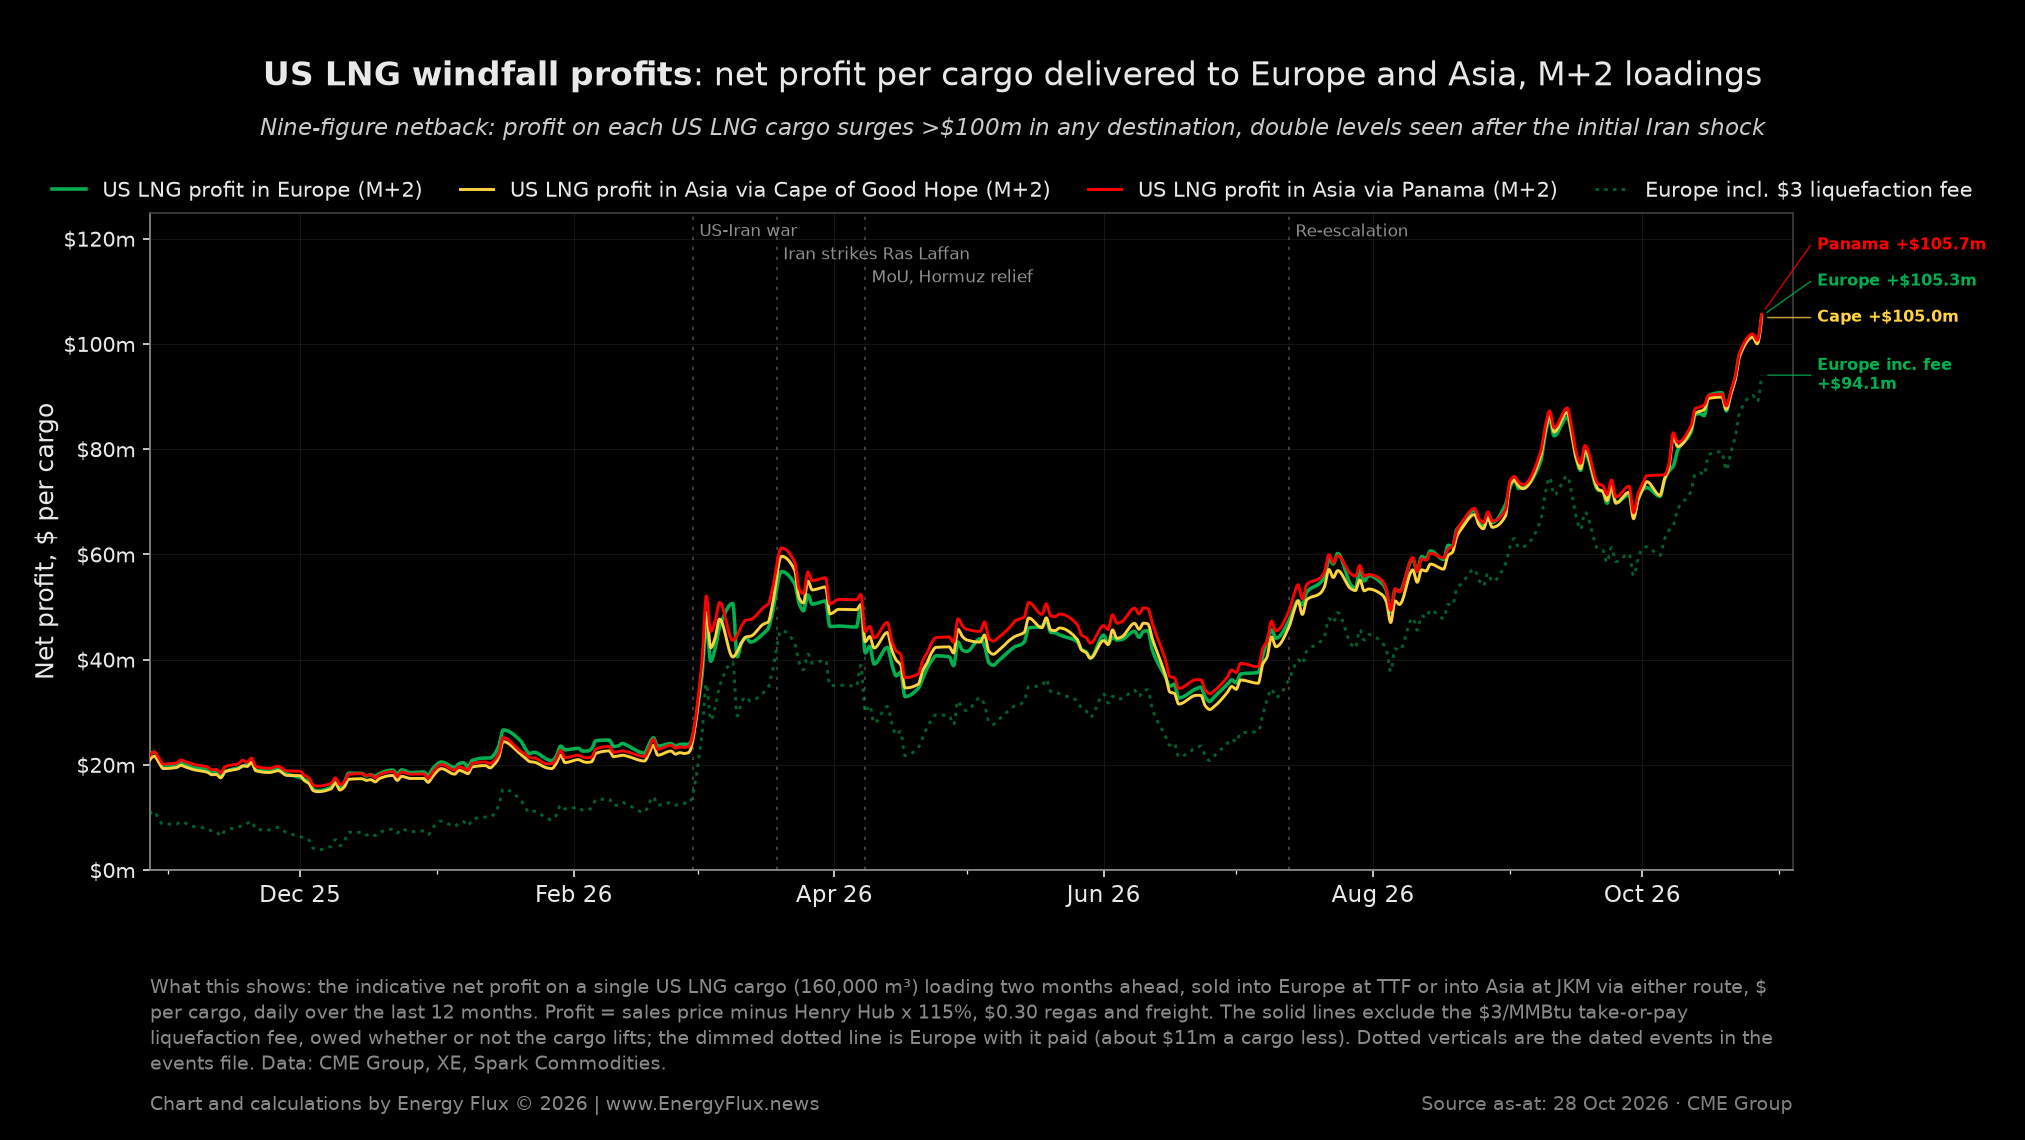
Even if you deduct the $3/MMBtu liquefaction fee, profit is still north of $94 million per cargo. This is roughly double where it was during Operation Epic Fury and the early March price shock (read more in War Profits, Quantified).
Little wonder, then, that US LNG pioneer Cheniere Energy boosted its quarterly dividend and reported a substantial upward revision to its full-year financial guidance in Q3’26 results released yesterday. The company’s New York-listed shares jumped 7%.
While Cheniere’s Henry Hub-linked free-on-board contracts let offtakers capture the arbitrage upside on LNG shipments to Europe, it retains some output for Cheniere Marketing to sell into global markets. Those revenues almost tripled year-on-year to a staggering $1.88 billion in Q3’26.
The coming winter of European discontent will surely propel them higher.

Constrained supply meets inelastic demand
There are two big differences between Q4’26 and Q4’21, and neither are particularly encouraging.
The first is Hormuz: LNG transits remain severely constrained and show no signs of recovering anywhere near pre-war volumes in the coming weeks or, most likely, months. So, Europe needs more winter LNG than it has ever imported to prevent storages running dangerously low, in a winter with structurally constrained supply.
That might sound overly-dramatic, and a mild weather scenario would certainly avoid a worst-case scenario. But as the Chart Deck reveals, even in an ‘average’ winter EU gas storage levels would end winter below the all-time lowest fill level of 28% (which happened in 2018).
The second difference is that overall EU natural gas demand is about 20% lower today than it was in winter 2021/22.
The stratospheric gas prices of 2022 triggered systematic closure of flexible and price-sensitive gas consumption segments. Fertilisers, bulk chemicals, glass, ceramics, paper and steel plants all suffered closures, mothballing and reduced operating rates as part of the broader deindustrialisation trend. Very little capacity returned since, and none is likely to now with TTF trading in triple digits.
Lower demand helps in a tight winter market but it leaves precious little flexibility if supplies are further disrupted, or a prolonged cold weather blast hits in late winter. The outlier scenario is that this could happen when storages are depleted to levels that curtail the rate at which gas can be withdrawn to meet a short-term surge in demand.
If you think this is far-fetched, take a read of the latest gas market monitoring report from ACER, the EU’s energy regulatory agency. The paper reveals that gas withdrawal capacities in Germany, France, Italy, and other member states fall by almost one-third when storage levels drop from 80% to 30% full.
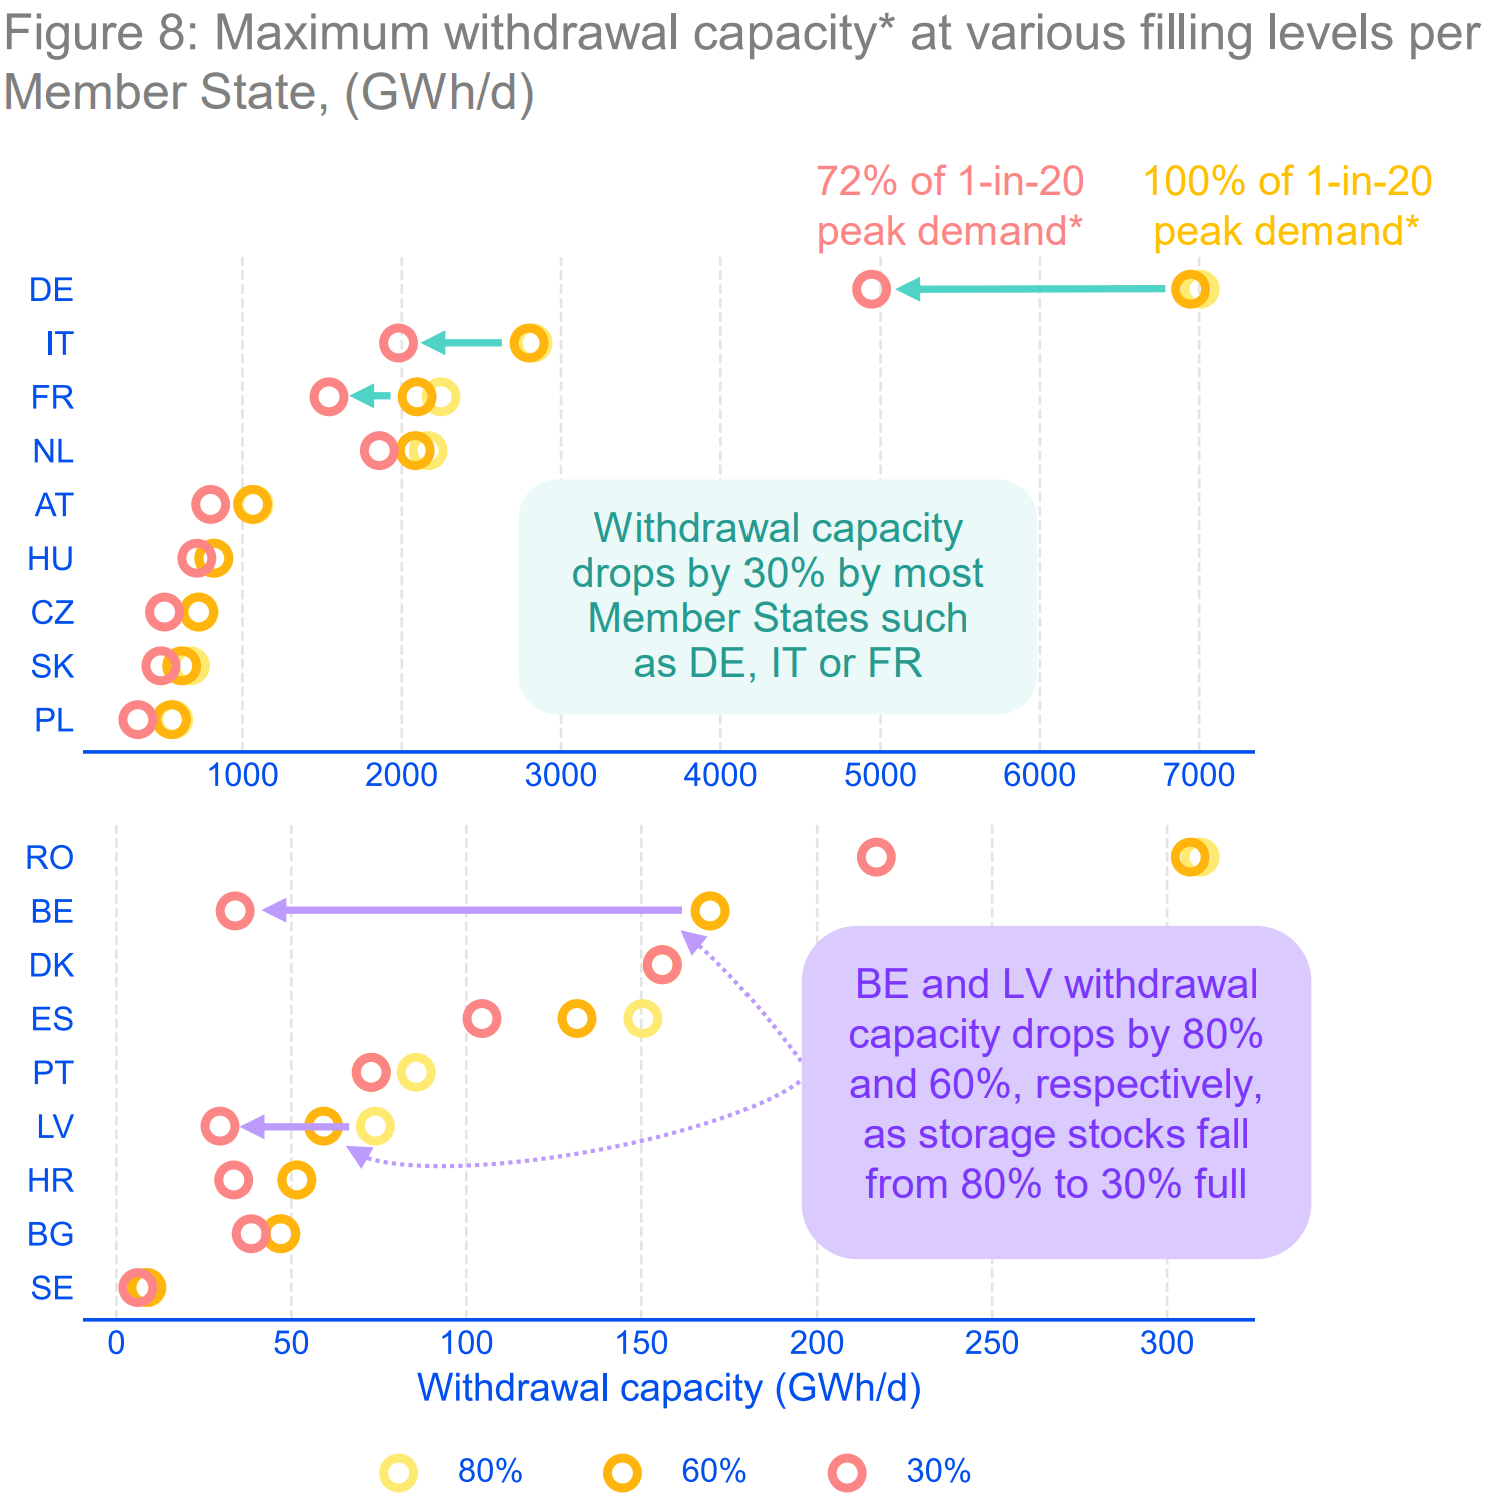
In other words, draining gas storages to bridge the gap between artificially tight LNG supply and normal winter demand is not ideal: it raises the risk of rapid gas deliverability in the event of a late winter cold snap.
This is the sort of market shock event that can trigger short-covering, a blowout in bid-offer spreads, and a cascading chain of stop-losses that vaporises liquidity and spikes TTF prices with little or no warning.
Such are the risks that stalk the European gas market this winter. This week’s subscriber-only Chart Deck examines in forensic detail the data and dynamics shaping each one.
Paid subscribers:
Download this week’s Chart Deck
In this issue:
- End-of-winter projections: Our storage model correctly predicted 75% by 1 November. Where does it see storage level depletion by 1 March, and how far could extreme weather push it off course?
- Storage-Speculation Nexus: Which delivery year is speculative capital now tracking most closely, and why might that be a riskier bet than it looks?
- Value-at-Risk: At €100 TTF, we estimate investment funds’ VaR sits well above the level at which they usually trim long exposure. But the near-term outlook is undeniably bullish. Which is the stronger force: risk aversion or bullish conviction?
- Options sensitivity: Options now account for 56% of funds’ TTF position. This fundamentally alters how to measure VaR; we explain why and quantify how far the options element moves the needle on speculative risk embedded in TTF
- The quest for pure signal: Options data confounds a simple read of the Commitment of Traders report. We strip options out to deliver a Gamma-free signal: is fund flow cleanly ‘risk on’ or ‘risk off’, or somewhere in between?
Plus the full suite of 137 slides in the Chart Deck itself:
- TTF / JKM / Henry Hub term structures & inter-basin arbitrage economics
- Freight rates, global LNG netbacks and physical flows by region
- The TTF Risk Model, our LNG Physical Balance Index and Storage-Speculation Nexus analytical model

Upgrade for the full Energy Flux analytical package covering physical and financial factors driving price formation in the European gas market
- Downloadable 137-slide Chart Deck in .PDF and .PPSX slideshow format
- 2,000+ words of sharp, analytical market narrative
- Top 5 charts from the deck highlighted for instant insight
- Full access to the Energy Flux web archive
Paid subscribers:
Download this week’s Chart Deck

Member discussion: US LNG’s nine-figure windfall
Read what members are saying. Subscribe to join the conversation.