The shock absorber cracks
For 55 days, the war-shocked global LNG market has been balanced by Asian state buyers going without. One just said, enough is enough.


Yesterday, Pakistan issued its first spot tender since December 2023. Pakistan LNG Limited wants three cargoes of approximately 140,000 m³ each, delivery at Port Qasim between 27 April and 14 May. Bids close today.
Pakistan went twenty-eight months without touching the spot market. It didn’t just sit it out; through 2024 and 2025 it was actively trying to offload LNG it didn’t need. Now, it does.
A consumer-driven >30 GW rooftop solar boom, the largest build-out relative to grid size of any country, knocked 11% off grid demand, stranding long-term obligations that had been sized for a very different energy scenario. Islamabad deferred five Qatari cargoes from 2025 into 2026, cancelled 21 Eni cargoes outright, and began reselling excess volume into regional markets on a Net Proceeds Differential basis, i.e. swallowing the risk of loss. As recently as mid-March, per IEEFA, Qatari- and Eni-contracted cargoes were still being diverted for 2026-27.
In other words: a few weeks ago, Pakistan was a seller. This week it is a buyer.
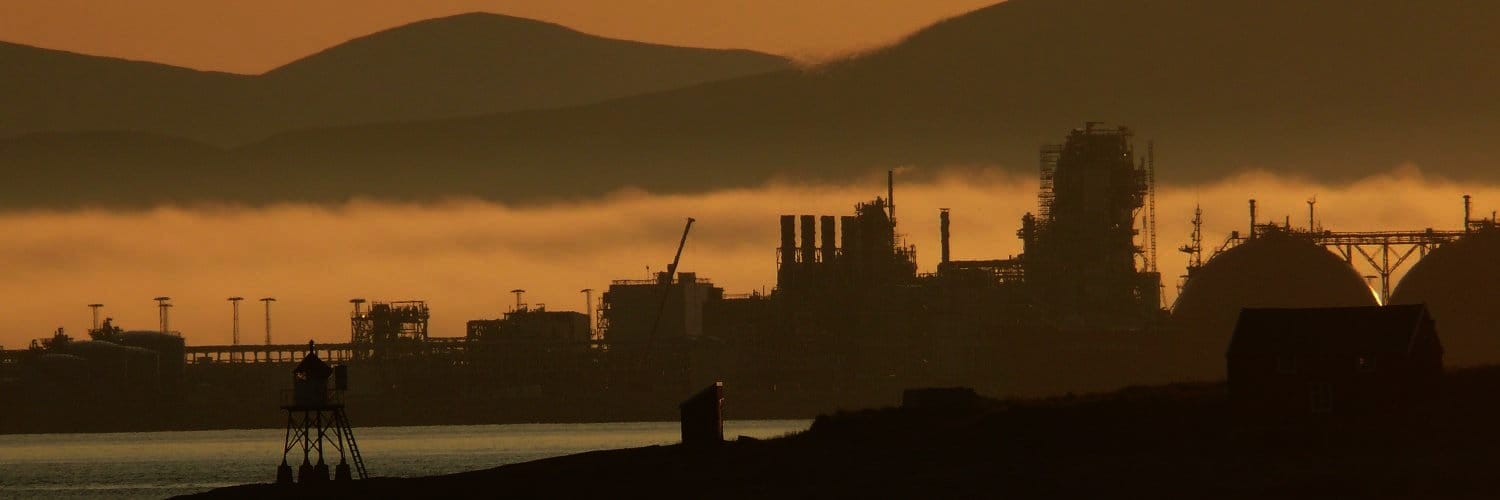
The reversal has been driven by a heatwave expected to persist into May, a 4.5 GW electricity deficit, and widespread blackouts in recent weeks. Energy Minister Awais Leghari told Reuters the government is “not sure when it will get more cargoes from Qatar”. Pakistan’s Power Division had initially requested four emergency cargoes; PLL is tendering for three.
This is not an isolated event. It is the latest data point in a pattern that has been building since Qatar declared force majeure on 4 March. Bangladesh broke first, and paid accordingly. Egypt is running a $5.4 billion tender on six-month deferred payment terms. Across South Asia, the real cost of the Hormuz closure is not just showing up only in LNG headlines; it is showing up in LPG shortages, rolling outages, and the first cracks in a fertiliser-to-harvest chain that is moving from theoretical risk to visible reality.
With Hormuz firmly shut, the global LNG market is being held in uneasy balance by the accumulated decisions of the most price-sensitive buyers in Asia to go without. Year-to-date (YTD) import data tells the story: with South Asian imports are down -1.2 Mt, net global balance tipped into deficit only because Europe pulled an extra +4.3 Mt of LNG toward itself. Just like in 2022, poorer economies bear the cost of balancing a war-shocked market.
The demand destruction mechanism is finite, but Europe’s TTF gas market is trading as if Asia can keep shielding European consumers from scarcity forever. Front-month TTF sits at €45/MWh ($15.50/MMBtu), still well below its early-March spike to €62 ($21). Hedge funds are cautiously unwinding a 323 TWh record net long — itself the consequence of the biggest weekly short-cover in recorded TTF futures history. The forward curve is flat through summer 2027 and sloping toward sub-$10/MMBtu by 2028. Summer-winter spreads are inverted: the market is actively discouraging storage injections at a moment when EU storage sits around 30% full, roughly 10 percentage points below the seasonal average.
This is not a market pricing a war. It is a market pricing a consensus that the war will soon end. The data suggest this is a potentially catastrophic misreading of the situation.
The rest of this letter is for paying subscribers.
Below the paywall: a 2,000-word analysis backed up by 100 data-rich slides in the downloadable Chart Deck.
- The force majeure cascade — why the ‘oil-indexed insulation’ story is structurally wrong and how utility books in Japan and Korea are quietly exposed
- Where the floor on Asian demand destruction is actually being set — Pakistan is tendering at ~$16 today; but Bangladesh set the bar much higher in March
- Europe’s storage dilemma — the asymmetric risk nobody in Brussels wants to name, why the Commission’s ‘flex to 80%’ letter may become the floor rather than the ceiling, and what ACER’s stark warning
- What the TTF forward curve is refusing to price — Energy Flux TTF Risk Model at -2, the forced-length unwind narrative, commercial hedgers pivoting, and five concrete watch-items that could break the current calm
- The 100-slide Energy Flux Chart Deck is published alongside this letter. TTF and JKM forward curves, CoT positioning decomposition, the TTF Risk Model with component weights, our Hormuz Closure LNG Supply Impact Model out to 2030, the Storage-Speculation Nexus, global LNG flow diagnostics. If you are making decisions against this market, you need this data.
Nobody else is publishing gas, LNG and TTF analysis at this depth, with this level of honesty, right now. One click below. Subscribe.

Member discussion: The shock absorber cracks
Read what members are saying. Subscribe to join the conversation.