The Hidden Ceiling
Value-at-Risk: Why TTF can’t break €50/MWh despite investment funds holding a record net long position in an unparalleled bullish setup

In late March, hedge funds built their biggest net long position in TTF history. Then, with war still raging and the bullish case for gas still intact, they began to cut it back. That contradiction is the starting point of this piece, and it points to something the headline positioning data cannot see: a hidden brake in the mechanics of the EU gas market.
The wall that won’t break
On 27 March 2026, investment funds’ aggregate net long position in ICE Endex TTF reached a new all-time record 323 TWh, with a face value of almost €18 billion. It was the largest fund long in the contract’s history, surpassing even the run-up to the 2022 crisis.
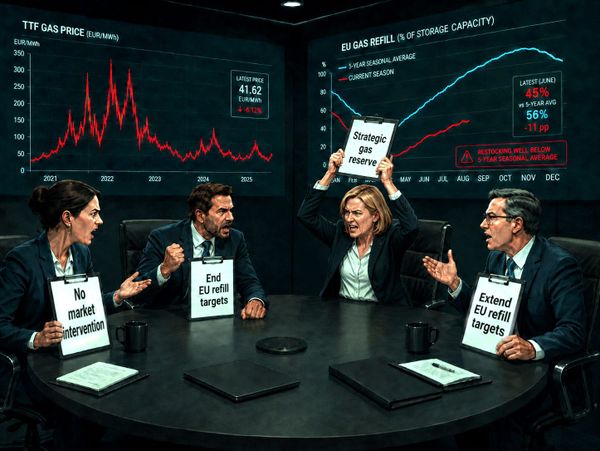
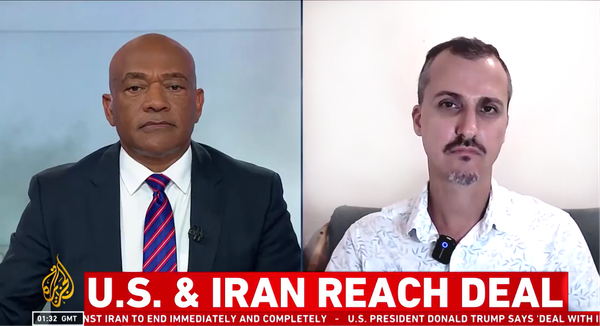
The backdrop appeared to support it. Since the US-Iran war broke out on 28 February, the Strait of Hormuz has been closed for more than two months, disrupting a route that normally carries around a fifth of global seaborne liquefied natural gas (LNG).
But then, TTF stalled.
The front-month price peaked at €61.50/MWh on 19 March before falling back to around €43/MWh by 6-7 May. TTF has traded mostly within a €40-€50/MWh range since early April despite a shock that, by historical comparison, should have produced a fresh leg higher.
At the same time, funds trimmed their long position. By the week ending 1 May, net length had fallen to 289 TWh, or €13 billion face value: down from the March extreme, though still high by any historical standard.
The puzzle is not why funds went long. It is why a record fund long, set against a still-powerful bullish backdrop, peaked and then pulled back without lifting TTF to new highs.
This Deep Dive examines one explanation that has received little attention: that fund positioning may itself have become a constraint on further upside.
What a fund actually buys
Most readers will know the weekly ICE Endex CoT report, which shows how different trader groups are positioned in TTF gas futures.
The usual reading is straightforward: if funds are heavily net long, they are positioned for higher prices; if they are net short, they are betting on lower prices. Bigger net length usually implies stronger bullish conviction.
That is useful, but only up to a point.
For many funds, the real constraint is not just how big a position is on paper, but how much risk it carries. And that depends not only on size, but on volatility.
A futures position does not consume cash in the way a stock purchase would. Futures are margined: the buyer puts up only a fraction of the position’s face value as collateral. That face value — the quantity of gas covered by the contract multiplied by the current price — is called the notional. It is the headline size of the bet. The margin is simply the cash needed to keep it alive.
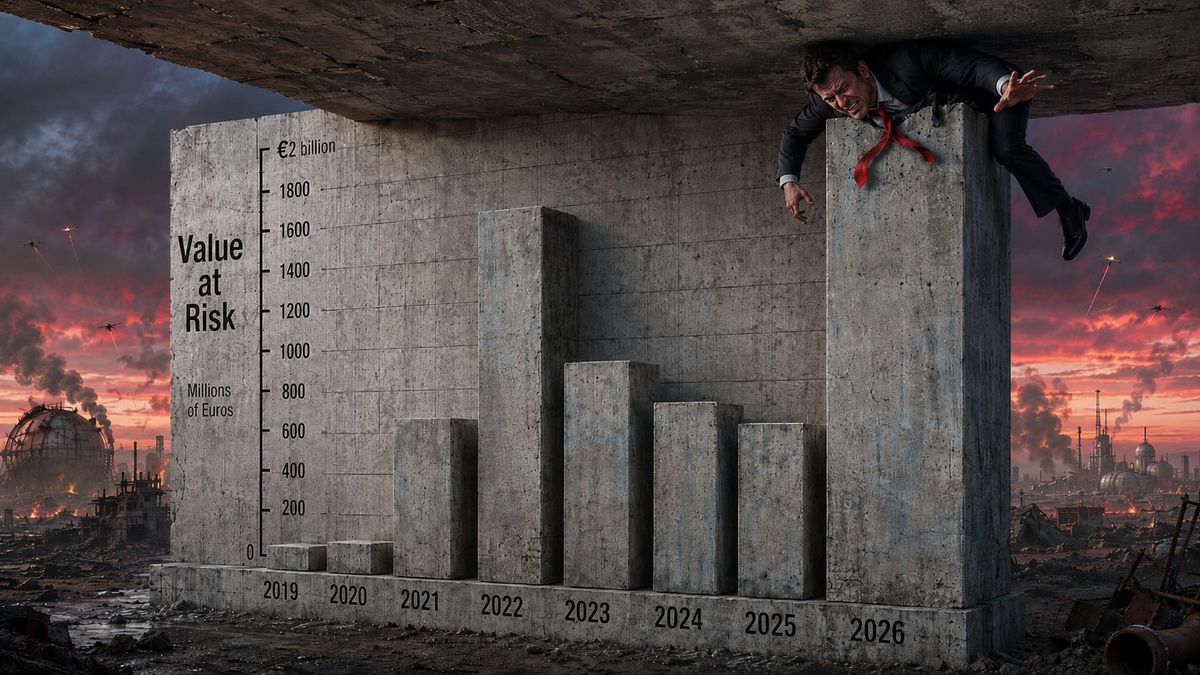
But for many funds, the binding constraint is not margin or notional. It is risk budget: the amount of loss the fund is prepared, or permitted, to absorb if the market turns against its position.
That is where VaR, or value at risk, comes in. In plain English, VaR is a way of estimating how much a position could lose over a normal bad trading day, given both its size and the market’s volatility.
A long TTF position of 100 MWh in a quiet market might look identical on paper to a 100 MWh long TTF position in a volatile market. In risk terms, they are very different.
The same position can be much harder to hold when volatility jumps. In that environment, funds may trim length not because their view has changed, but because the position’s VaR exceeds internal limits.
The CoT report shows the size of the position. It does not show how expensive that position is to carry.
This special Deep Dive is an exercise in re-expressing the European gas market in risk-adjusted terms: quantifying the VaR that investment fund positioning actually consumes, not just what its face value reads.
It applies a proxy measure for volatility to the entire ICE Endex TTF CoT data set to identify distinct risk regimes since 2019.
The findings help to solve the central puzzle of spring 2026: why TTF appeared to hit a ceiling even as an historic LNG supply shock kept the case for higher prices alive.
It explores a plausible explanation that has been largely missing from the debate: that speculative fund positioning had become so risk-heavy that it could no longer keep driving prices higher, and what that means for the EU gas market as the Hormuz crisis drags on.
💥 Article stats: 6,000 words, 20-min reading time, 16 charts & graphs
Below this line is the full risk-adjusted view of TTF set against seven years of positioning data.
The framework combines weekly CoT exposure with realised volatility to build a simple proxy for VaR across price regimes: how much risk funds were likely carrying during and after Covid, Russia-Ukraine, and now in the midst of the US-Iran stalemate.
This approach sheds new light on the European gas market in 2026: from net short in January, to a record fund long in March, to active trimming even as the crisis endured. The goal is to understand why TTF has struggled to break €50/MWh despite a still-bullish backdrop, and what would need to change for that ceiling to be breached.
Subscribers get the full set of charts, methodology, caveats, and forward-looking conclusions that could fundamentally alter how you read the European gas market.

Member discussion: The Hidden Ceiling
Read what members are saying. Subscribe to join the conversation.