The ceiling softens
The hard risk budget cap keeping TTF below €50 has lifted. What remains is softer, stranger and harder to trade: a market with room to rally, but no-one willing to push through.


European gas prices have spent the Hormuz crisis pressing against an invisible cap. Each escalation lifted the market, but not far enough. Dutch TTF, the European benchmark, kept returning to the same awkward line around €50/MWh.
The cap was not physical supply; it was financial positioning. Investment funds built a huge bullish bet as the crisis intensified. Then volatility surged, making that bet more expensive to hold in risk terms. The funds still had reasons to be bullish, but less room to buy more.
That was the hidden ceiling. Bullish news could lift prices, but the marginal long buyer had already spent too much of its risk budget to chase the move. Through April and May, that helped explain why TTF struggled to break durably above €50/MWh, even as Hormuz disruption kept the physical risk alive.
Now that constraint has eased.
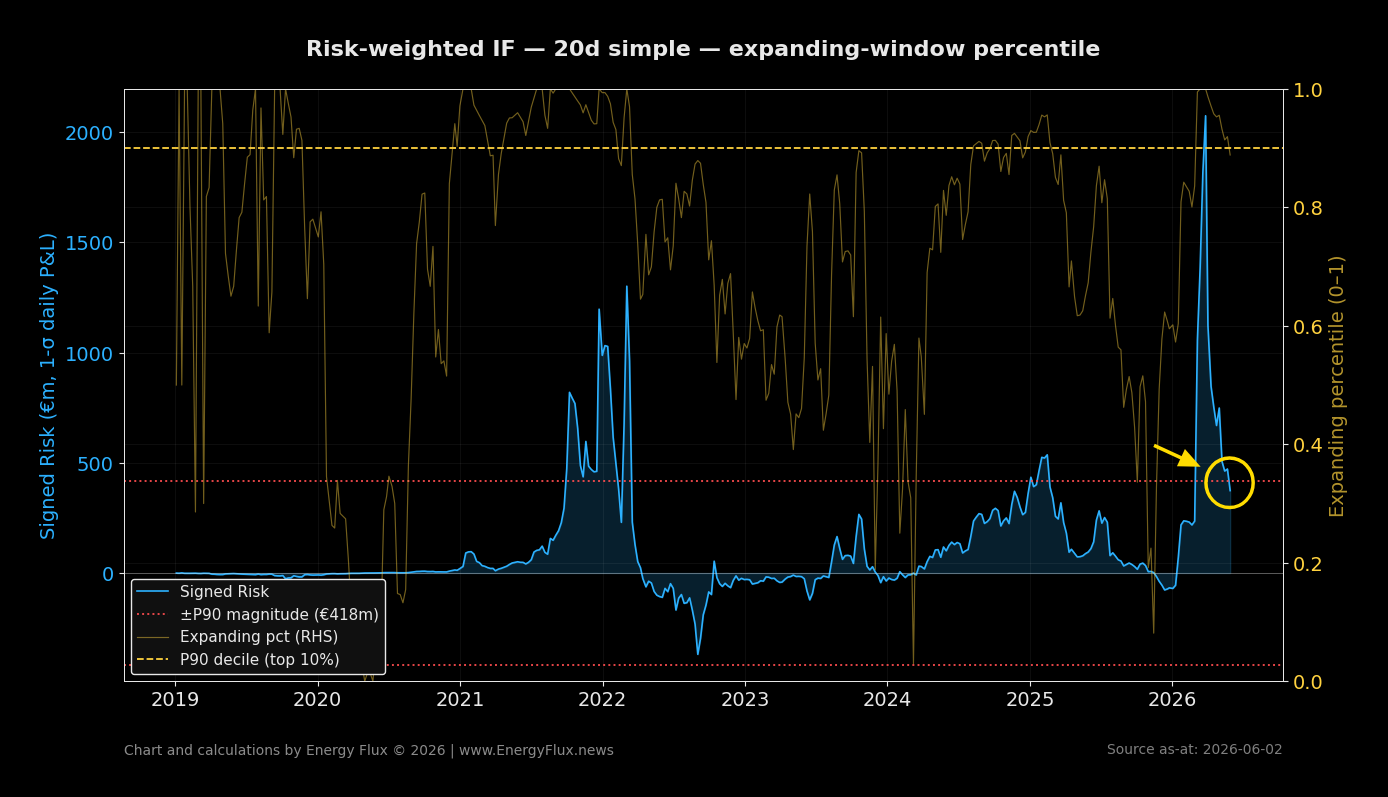
The latest ICE Endex data, for the week ending 29 May, shows how far the reset has gone. Fund risk consumption on our main 20-day measure has fallen to €374m, down 82% from the late-March peak of €2.07bn.
For the first time since the US–Iran war erupted in February, implied value-at-risk (VaR) is back below the €418 million mark that defines the top decile of the 2019–26 distribution.
That matters for what it removes. The old ceiling was hard because funds were already stretched. This one is softer. The bulls have their ammunition back. They are just not firing.
So why is TTF still capped around €50/MWh, pulling back at this price point even as renewed Iranian strikes on Gulf targets put Hormuz risk front and centre of energy market sentiment?

The full weekly Chart Deck below traces the €50 ceiling through the CoT data, the TTF Risk Model and the global LNG physical balance.
Paid subscribers get 100+ slides mapping the pressure points across European gas and LNG markets, plus the subscriber-only analysis that turns the charts into a coherent market view.
The ceiling has not vanished; it has changed shape. Get the full picture 👇

Member discussion: The ceiling softens
Read what members are saying. Subscribe to join the conversation.