The TTF options paradox, explained
How options work, how they appear in fund positioning, and what they add to Energy Flux’s risk models.

ICE Endex, the exchange where the benchmark EU gas contract Dutch TTF is traded, quietly added a new line to its Commitment of Traders report last week that could sharpen our understanding of European gas markets.
At first glance, the unassuming row of numbers buried in an obscure data sheet appears unremarkable. Look closer, and it reveals a great deal about the structure of the European natural gas market and the incentives that govern it.
Until now, CoT positioning data bundled TTF futures and options together, as X terawatt-hours of long positions and Y terawatt-hours of shorts. Everyone knew some portion was held through options, but the public report did not reveal how much.
Now we know the answer, and it’s a moveable feast: the options data will be updated from week to week.
Options behave differently from outright futures, so this new TTF data stream opens another dimension in our ongoing analysis of price, positioning, conviction, volatility and risk.
Under the new reporting rules, ICE now publishes both a combined count and a futures-only count. The first split, for the week to 28 August, shows that roughly two-fifths of investment funds’ net bullish exposure came through options:
| Investment-fund positions in TTF, week to 28 Aug 2026 | Long, TWh | Short, TWh | Net, TWh |
| Futures plus options the number we have always used | 369 | 149 | 219 |
| Futures only | 321 | 189 | 133 |
| Held through options the difference | +47 | −39 | +87 |
| Source: ICE Endex Commitment of Traders (MiFID II). Energy Flux © 2026 | |||
As you can see, four in ten TWh of the funds’ net length sits in options, not futures. On the other side of that trade are the banks and brokers, whose options slice is 101 TWh short.
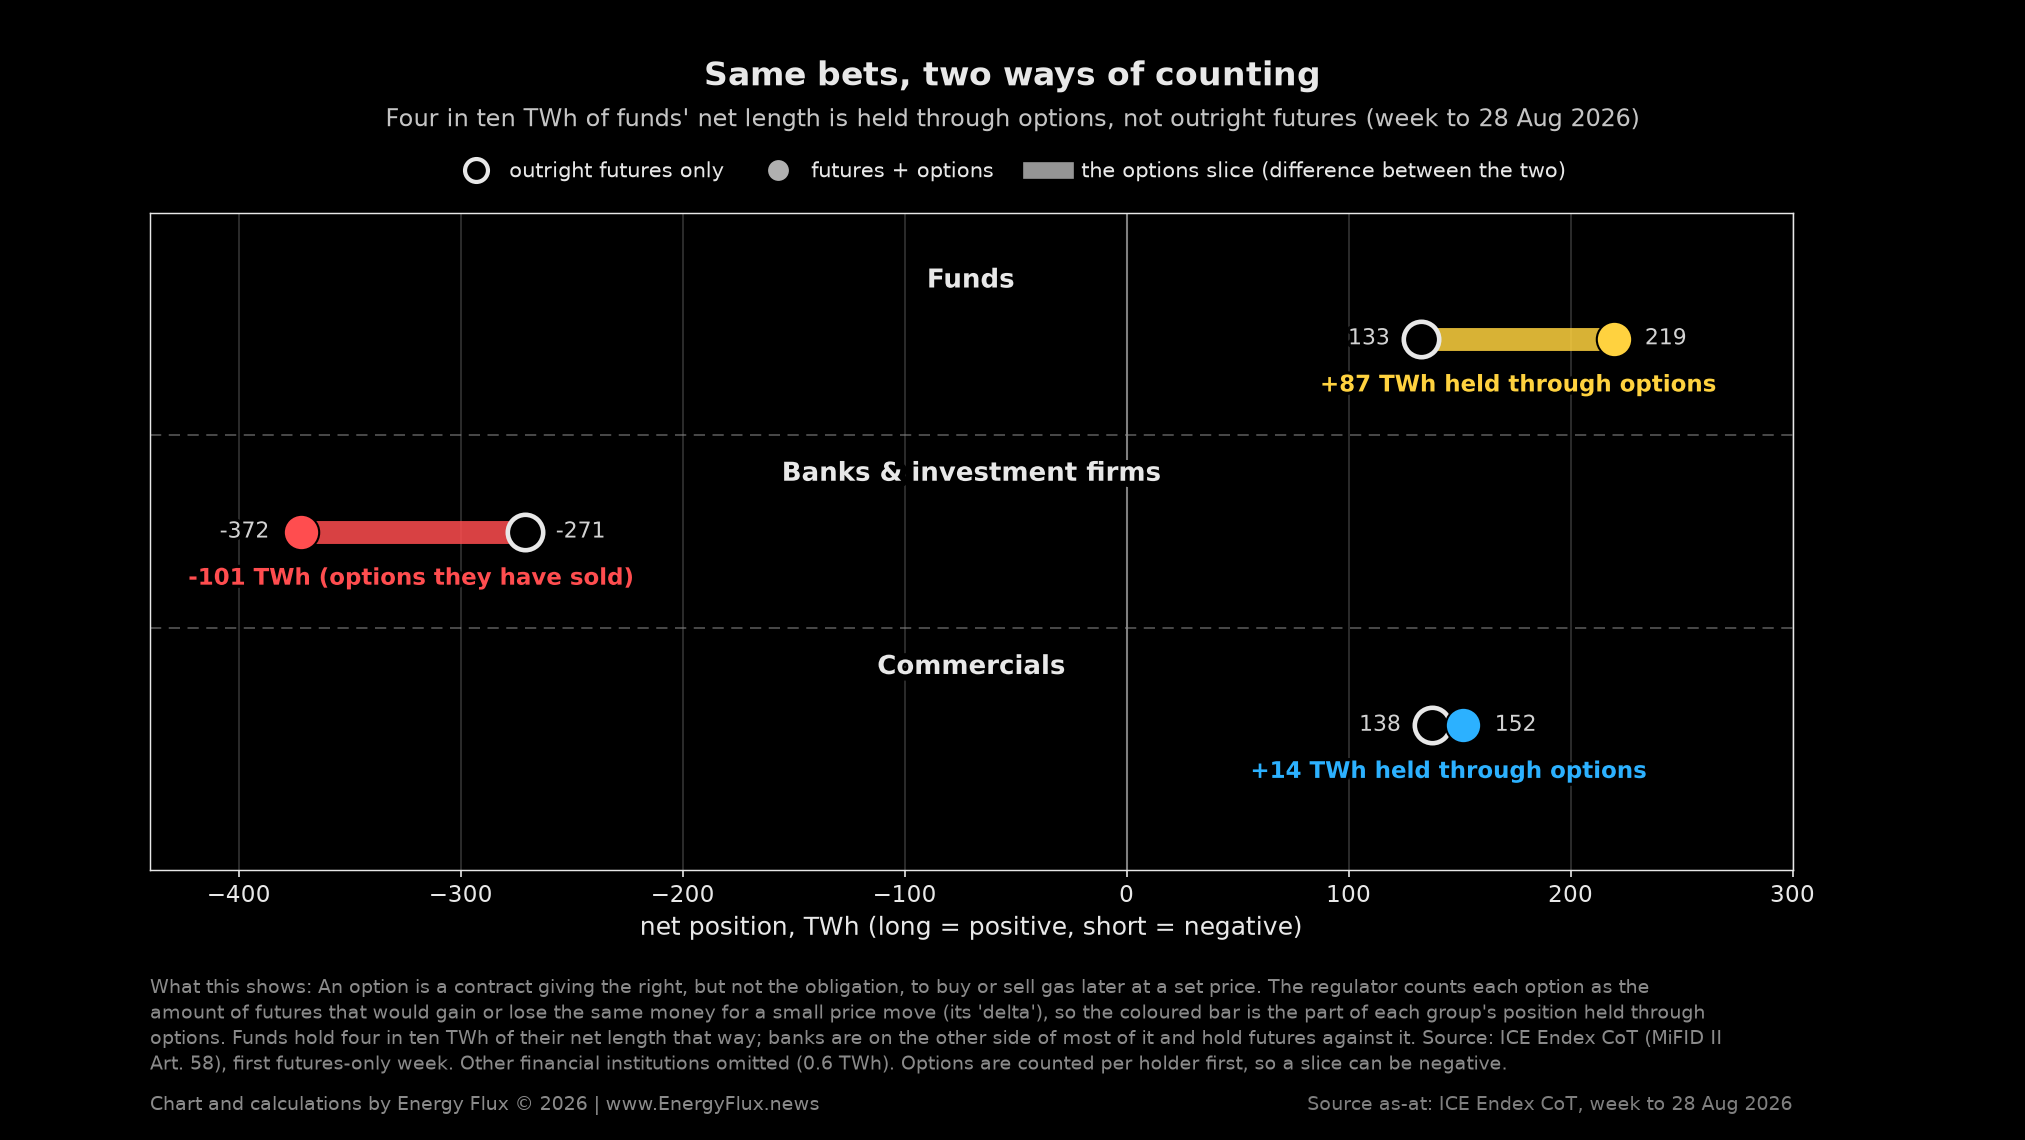
Those options already entered Energy Flux’s positioning and risk calculations through the combined series. The new disclosure lets us look inside that number, and it lays bare a paradox: reported fund length can grow without a single new trade being executed, while two positions that look identical in the weekly report can lose very different amounts in a big market move.
Resolving that paradox is what this article sets out to do. We will follow an option from its payoff to how it is counted in the weekly CoT report, then explore how different options assumptions might affect our reading of risk – and how the new options data will be used to enrich our coverage of the European natural gas market.
💥 Article stats: 2,600 words, 10-min reading time, 7 charts and tables

Member discussion: The TTF options paradox, explained
Read what members are saying. Subscribe to join the conversation.