
Chart Deck
Europe’s gold-plated energy crisis
Hedge funds cash in as winter scarcity fears ignite EU gas market
Chart Deck
Hedge funds cash in as winter scarcity fears ignite EU gas market
Deep Dives
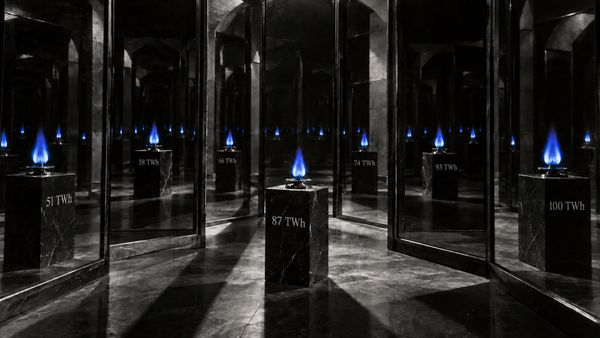
How options work, how they appear in fund positioning, and what they add to Energy Flux’s risk models.

Chart Deck
European gas is trading in the fleeting umbra of an eerie calm. Eclipses always end — and this one ends in a searing winter burn

Chart Deck
Attempts to break the US-Iran stalemate are raising the risk of conflict sprawling sideways into dimensions the market has not yet priced
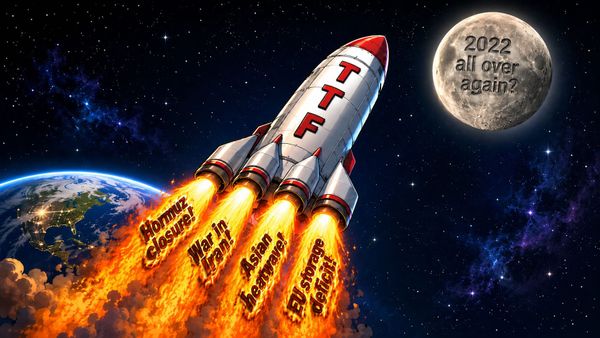
Chart Deck
EU gas price surges past €60 per MWh. But is the top already in?
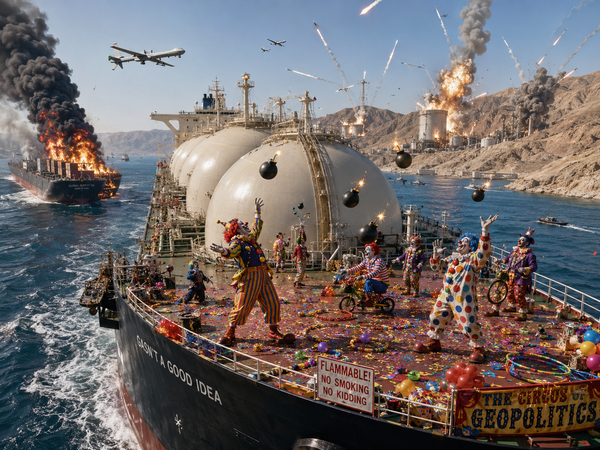
Chart Deck
Diplomacy has taken the back seat in the clown car. Markets have stopped laughing and started buying
Chart Deck
“After four months of paralysis, the relief is palpable. It may also be misleading. And it is almost certainly temporary.” – Energy Flux, 26 June 2026 Well, that didn’t last long. Barely three weeks into a supposed two-month ceasefire, US missiles and Iranian drones are criss-crossing the Persian
Chart Deck
Iran holds the valve, but it is worth less every time it turns... so Tehran is reaching for the gun.
Chart Deck
Markets have priced the US–Iran ceasefire as a fully-fledged peace deal. The 60-day clock, and our models, suggest otherwise.
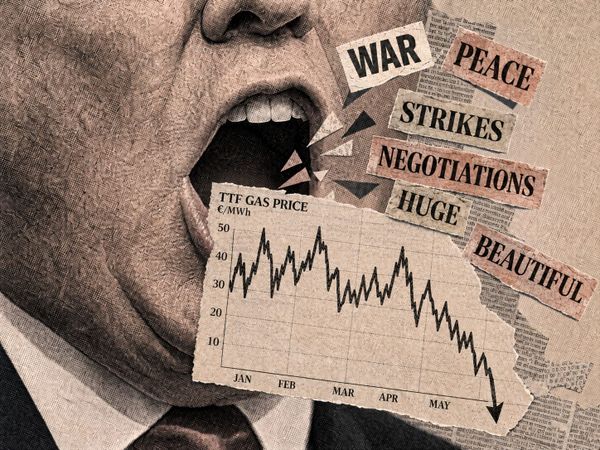
Chart Deck
Credulous energy markets have stopped pricing Iran, and started pricing Trump’s presidential word salads instead. This cannot end well.

Chart Deck
The hard risk budget cap keeping TTF below €50 has lifted. What remains is softer, stranger and harder to trade: a market with room to rally, but no-one willing to push through.
Chart Deck
Atlantic LNG is heading east. EU storage refill is falling behind. And TTF keeps stalling below €50/MWh. This week’s Chart Deck explains why this apparent equilibrium is as soft as melting butter.